. 2016 Aug 27;17(1):686.
doi: 10.1186/s12864-016-3025-3.

Molecular and structural considerations of TF-DNA binding for the generation of biologically meaningful and accurate phylogenetic footprinting analysis: the LysR-type transcriptional regulator family as a study model

Affiliations

Molecular and structural considerations of TF-DNA binding for the generation of biologically meaningful and accurate phylogenetic footprinting analysis: the LysR-type transcriptional regulator family as a study model

Patricia Oliver et al. BMC Genomics. .

Abstract

Background: The goal of most programs developed to find transcription factor binding sites (TFBSs) is the identification of discrete sequence motifs that are significantly over-represented in a given set of sequences where a transcription factor (TF) is expected to bind. These programs assume that the nucleotide conservation of a specific motif is indicative of a selective pressure required for the recognition of a TF for its corresponding TFBS. Despite their extensive use, the accuracies reached with these programs remain low. In many cases, true TFBSs are excluded from the identification process, especially when they correspond to low-affinity but important binding sites of regulatory systems.

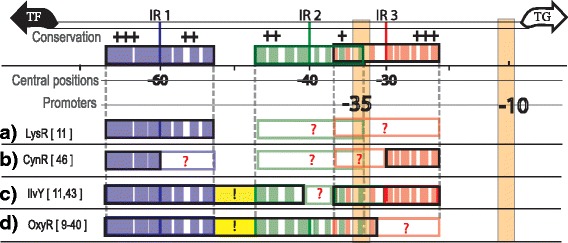
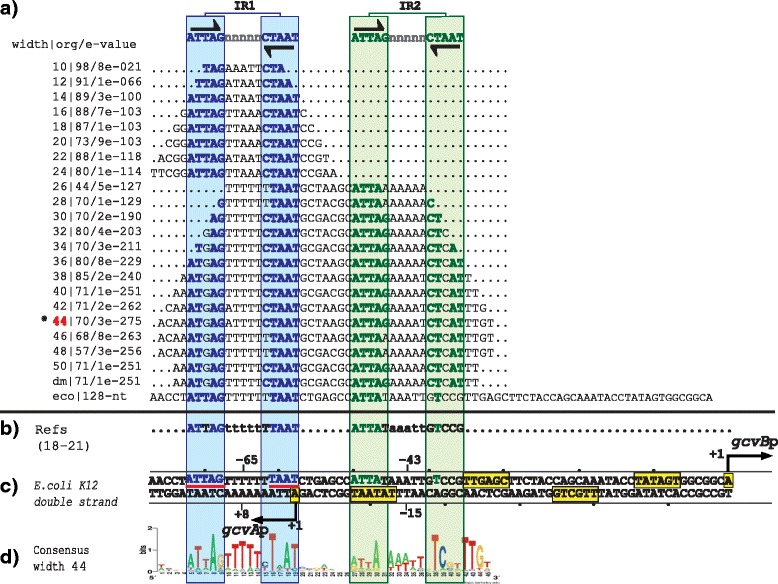
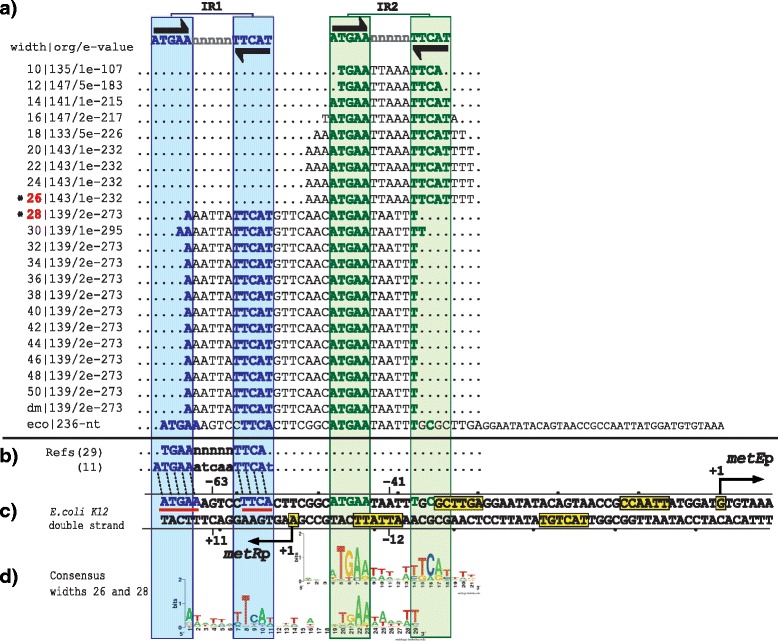
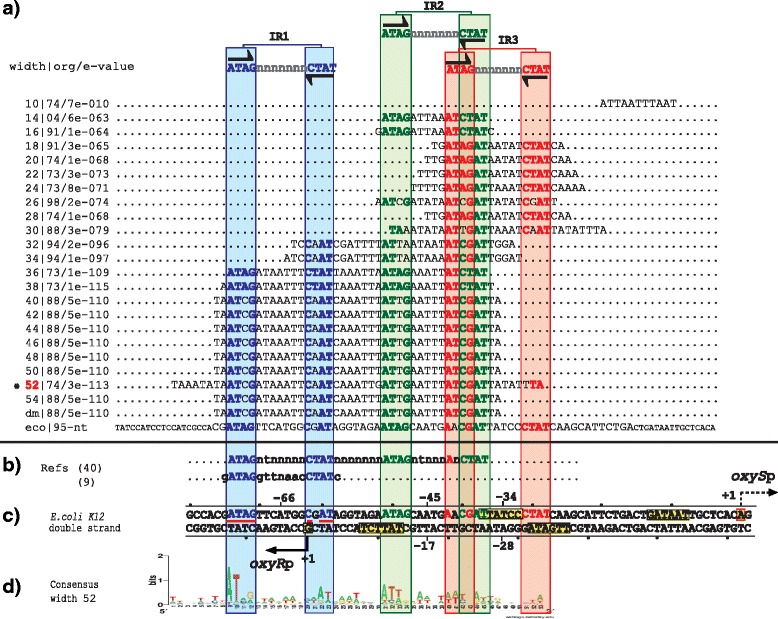
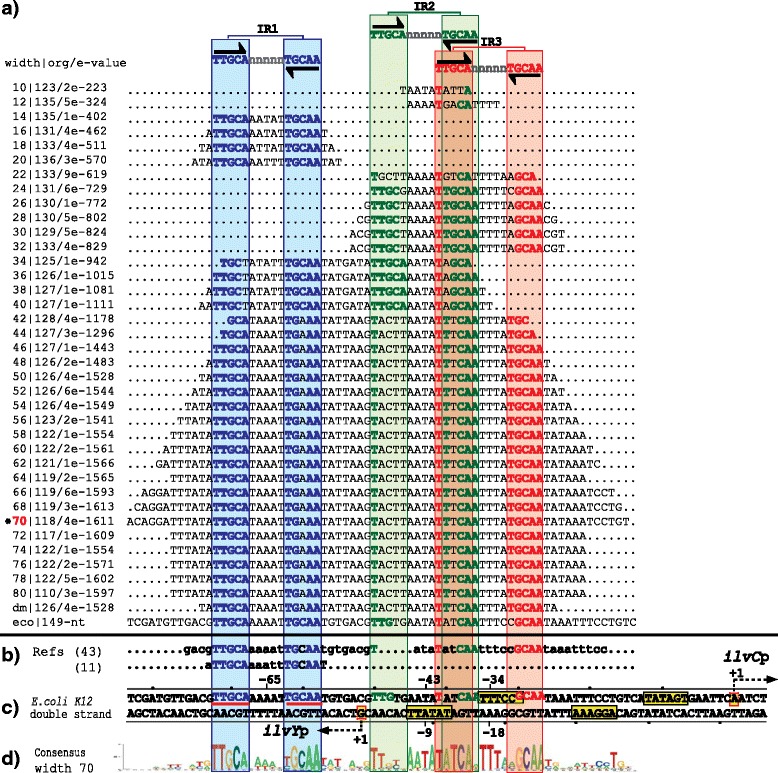
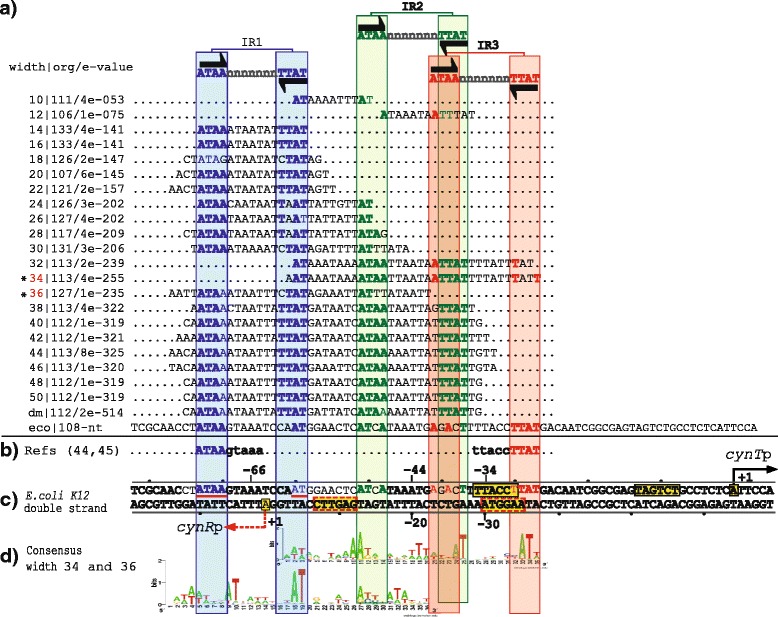
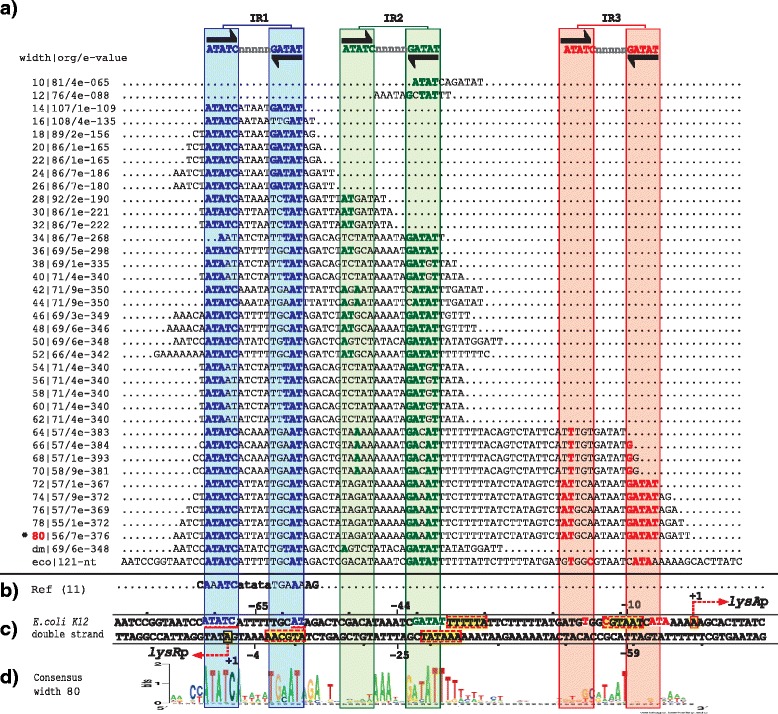
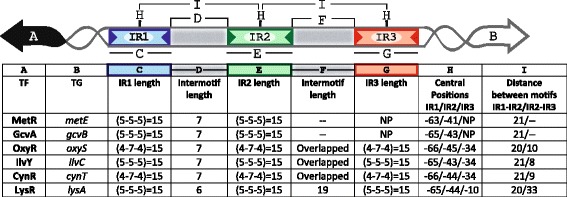
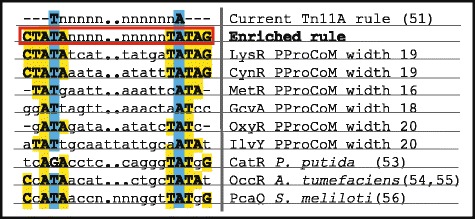
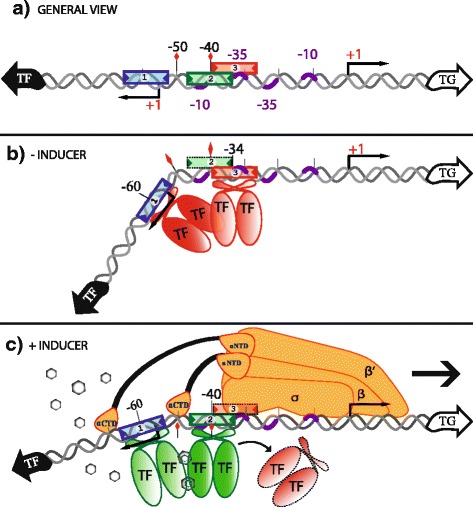
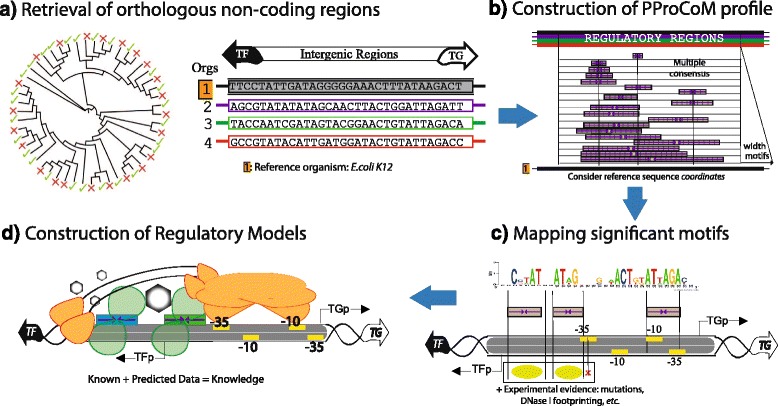
Results: We developed a computational protocol based on molecular and structural criteria to perform biologically meaningful and accurate phylogenetic footprinting analyses. Our protocol considers fundamental aspects of the TF-DNA binding process, such as: i) the active homodimeric conformations of TFs that impose symmetric structures on the TFBSs, ii) the cooperative binding of TFs, iii) the effects of the presence or absence of co-inducers, iv) the proximity between two TFBSs or one TFBS and a promoter that leads to very long spurious motifs, v) the presence of AT-rich sequences not recognized by the TF but that are required for DNA flexibility, and vi) the dynamic order in which the different binding events take place to determine a regulatory response (i.e., activation or repression). In our protocol, the abovementioned criteria were used to analyze a profile of consensus motifs generated from canonical Phylogenetic Footprinting Analyses using a set of analysis windows of incremental sizes. To evaluate the performance of our protocol, we analyzed six members of the LysR-type TF family in Gammaproteobacteria.

Conclusions: The identification of TFBSs based exclusively on the significance of the over-representation of motifs in a set of sequences might lead to inaccurate results. The consideration of different molecular and structural properties of the regulatory systems benefits the identification of TFBSs and enables the development of elaborate, biologically meaningful and precise regulatory models that offer a more integrated view of the dynamics of the regulatory process of transcription.

Keywords: Binding sites; LTTR; LysR-type transcription regulator family; Motif profile; Phylogenetic footprinting analysis; Transcription factors; Transcription regulation.


Figures

Fig. 1
Fig. 1
Common types of incorrectly identified regulatory motifs in phylogenetic footprinting analyses that do not correspond to real TFBSs of the LysR-type family in Gammaproteobacteria. The TFs belonging to the LysR-type family in Gammaproteobacteria are commonly transcribed in a divergent orientation with respect to their TGs. In the intergenic region of the TF-TG, there are two to three IRs, represented by purple (IR1), green (IR2) and red (IR3) boxes. The -35 and -10 boxes of the TG are represented by cream rectangles. The question marks represent motif regions that are not commonly identified, while the exclamation marks represent DNA regions that are not part of the regulatory motif but were identified as such. Due to the molecular bases of the regulatory systems, each TFBS was recognized with different affinities by their corresponding TF. Therefore, their sequence conservation varies, wherein IR1 is the most conserved sequence and IR2 is the least conserved sequence. Additionally, the sequence conservation within an IR sequence also presents important differences. Colored spaces within the boxes represent nucleotides of the motif that are more conserved, while white spaces represent poorly conserved nucleotides. Additionally, nucleotide conservation levels of the motifs are represented with plus signs (+), with +++ (three plus signs) indicating DNA regions with the most conserved nucleotides and + (one plus sign) indicating less conserved DNA regions. In each example, the name of the TF of the regulatory system and its corresponding references are indicated. a Only IR1, the most conserved of the IRs, is identified. b Only the most conserved parts of IR1 and IR3 are identified. c A large DNA region including IR1, the most conserved part of the IR2 and IR3 are identified. Additionally, the DNA regions between IR1 and IR2 that are not recognized by the TF are also incorrectly included. d A contiguous long DNA region, including the contiguous IR1 and IR2 sequences and the sequence between them, are reported as the TF-binding sequence
Fig. 2
Fig. 2
PProCoM analysis of the gcvA-gcvB intergenic regions in Gammaproteobacteria. a Profile of multiple consensus sequences of increasing length positioned relative to the E. coli K12 gcvA-gcvB intergenic region. In the left column, separated by a pipe, the window width used in each MEME analysis, the E-value obtained for each motif and the number of organisms presenting the identified motif (out of 150 Gammaproteobacteria used in our analysis) are indicated. The last of these consensus sequences is indicated as dm and corresponds to the default motif without forcing the size of the analysis window (see the Methods section). The consensus motifs of the IR sequences (IR1 and IR2) are displayed at the top of the figure and are represented with inverted black arrows. b TFBSs with experimental reported evidence, with references cited on the left side of the figure. c Each one of the identified motifs was mapped into the E. coli K12 gcvA-gcvB intergenic region and was used as a reference. Black arrows indicate TSSs that had been previously identified or proposed in our study. The -35 and -10 promoter boxes are indicated with yellow boxes. TSSs and -35 and -10 promoter boxes are indicated with solid lines if these elements had been previously reported and with dashed lines if these elements were identified based on our PProCoM analysis. The center positions of the IR motifs related to the beginnings of transcription of the genes coding for the TF or TG are indicated. The nucleotides of the E. coli IR1 sequence, matching the consensus, are underlined with red lines. d A LOGO corresponding to a representative consensus was selected from the profile of a consensus of the section (marked with a red asterisk) and is shown. This LOGO includes all of the regulatory motifs of the intergenic region of study
Fig. 3
Fig. 3
PProCoM analysis of the metR-metE intergenic regions in Gammaproteobacteria. The descriptions of sections (a to d) and the symbols are the same as those of Fig. 2. d None of the motifs obtained using the different analysis window sizes include all IR sequences of the intergenic metR-metE region; therefore, the LOGOs of two different window sizes are included
Fig. 4
Fig. 4
PProCoM analysis of the oxyR-oxyS intergenic regions in Gammaproteobacteria. The descriptions of sections (a to d) and the symbols are the same as those of Fig. 2
Fig. 5
Fig. 5
PProCoM analysis of the ilvY-ilvC intergenic regions in Gammaproteobacteria. The descriptions of sections (a to d) and the symbols are the same as those of Fig. 2
Fig. 6
Fig. 6
PProCoM analysis of the cynR-cynT intergenic regions in Gammaproteobacteria. The descriptions of sections (a to d) and the symbols are the same as those of Fig. 2. d None of the motifs obtained using the different analysis window sizes includes all IR sequences of the intergenic cynR-cynT region; therefore, the LOGOs of two different window sizes are included
Fig. 7
Fig. 7
PProCoM analysis of the lysR-lysA intergenic regions in Gammaproteobacteria. The descriptions of sections (a to d) and the symbols are the same as those of Fig. 2
Fig. 8
Fig. 8
Architecture of the TFBSs of the LysR-type TF family in Gammaproteobacteria revealed by PProCoM analysis. A common characteristic of the members of the LysR-type family in Gammaproteobacteria is that their coding genes and corresponding target genes are transcribed in divergent orientations, and their intergenic regions present two or three inverted repeated motifs, IR1, IR2 and IR3. The architecture of the intergenic regions of the six TFs analyzed in our study is summarized. Clear conservations of motif length and inter-motif distance suggest that there are similarities in their molecular regulatory mechanisms
Fig. 9
Fig. 9
Consensus sequence for the TFBSs of the LysR-type TF family. The T-n11-A motif was originally proposed by Goethals et al. [51] as the consensus sequence recognized by members of the LysR-type family. Considering the results of our PProCoM analysis of the TFBSs of six representative members of this family in Gammaproteobacteria, we defined a new and extended version of this motif: 5′-CTATA-n9-TATAG-3′. Additionally, examples of the sequence consensus of the TFBSs of other members of the LysR-type family that have been experimentally verified are also shown and include the distal TFBSs of CatR of the Gammaproteobacteria Pseudomonas putida [53], OccR of the Alphaproteobacteria Agrobacterium tumefaciens [53, 54] and PcaQ of the Alphaproteobacteria Sinorhizobium meliloti [56]. Dots within the inter-motif sequences were used to align the conserved nucleotides of the consensus sequences
Fig. 10
Fig. 10
Representative regulatory models of the LysR-type TF family in Gammaproteobacteria revealed by PProCoM analyses. a A typical architecture of the regulatory regions of these TFs is the presence of three IR sequences, represented by blue (IR1), green (IR2) and red (IR3) boxes. Some regulatory systems, such as those of our first analysis group, GcvA and MetR, lack the third IR element. b Because the sequence affinities of IR1 and IR3 (observed as sequence conservation of the motifs) are greater than the one for IR2, in the absence of the inducer, the TF of the system only binds to the IR1 and IR3 sites. The positions of IR1 and IR3 are critical for the transcriptional repression of divergent systems. IR1 overlaps the TF promoter, while IR3 overlaps the TF and the TG promoters. c In the presence of the system inducer, the TF dimer can bind cooperatively to a less conserved and less affine IR in the system, i.e., IR2. A remarkable characteristic of several regulatory systems in this family is that IR2 partially overlaps IR3; therefore, a first consequence of the binding of the TF to IR2 is the steric displacement of the TF that was bound to IR3, resulting in TG transcription repression. In addition to this de-repression effect, a second effect of the binding of the TF to IR2 is direct transcriptional activation of the TG due to the position of IR2 immediately upstream of the -35 promoter box of the TG, where the TF interacts with the RNAP. Figure modified from [57]
Fig. 11
Fig. 11
PProCoM workflow. The PProCoM workflow includes four main steps, represented by the units (a to d). These steps are fully described in the Methods section

References

    1. Molina N, van Nimwegen E. Scaling laws in functional genome content across prokaryotic clades and lifestyles. Trends Genet. 2009;25:243–7. doi: 10.1016/j.tig.2009.04.004. - DOI - PubMed
    1. Martínez-Antonio A, Collado-Vides J. Identifying global regulators in transcriptional regulatory networks in bacteria. Curr Opin Microbiol. 2003;6:482–9. doi: 10.1016/j.mib.2003.09.002. - DOI - PubMed
    1. Pérez-Rueda E, Collado-Vides J. The repertoire of DNA-binding transcriptional regulators in Escherichia coli K-12. Nucleic Acids Res. 2000;28:1838–47. doi: 10.1093/nar/28.8.1838. - DOI - PMC - PubMed
    1. Huerta AM, Salgado H, Thieffry D, Collado-Vides J. RegulonDB: a database on transcriptional regulation in Escherichia coli. Nucleic Acids Res. 1998;26:55–9. doi: 10.1093/nar/26.1.55. - DOI - PMC - PubMed
    1. Tagle DA, Koop BF, Goodman M, Slightom JL, Hess DL, Jones RT. Embryonic epsilon and gamma globin genes of a prosimian primate (galago crassicaudatus). Nucleotide and amino acid sequences, developmental regulation and phylogenetic footprints. J Mol Biol. 1988;203:439–55. doi: 10.1016/0022-2836(88)90011-3. - DOI - PubMed

Publication types

MeSH terms

LinkOut - more resources