

Antioxidants Rescue Mitochondrial Transport in Differentiated Alzheimer's Disease Trans-Mitochondrial Cybrid Cells
- PMID: 27567872
- PMCID: PMC5562501
- DOI: 10.3233/JAD-160532
Antioxidants Rescue Mitochondrial Transport in Differentiated Alzheimer's Disease Trans-Mitochondrial Cybrid Cells
Abstract
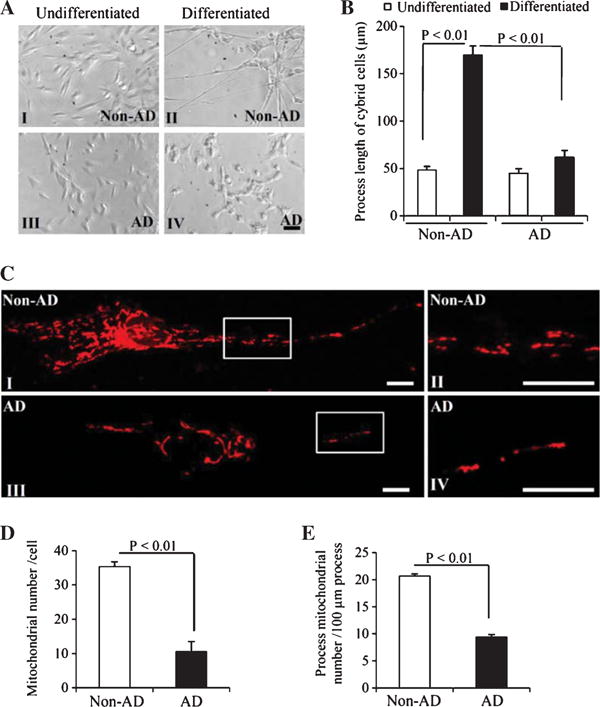
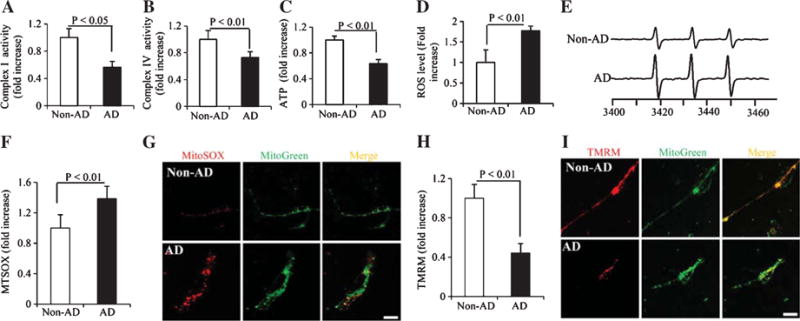
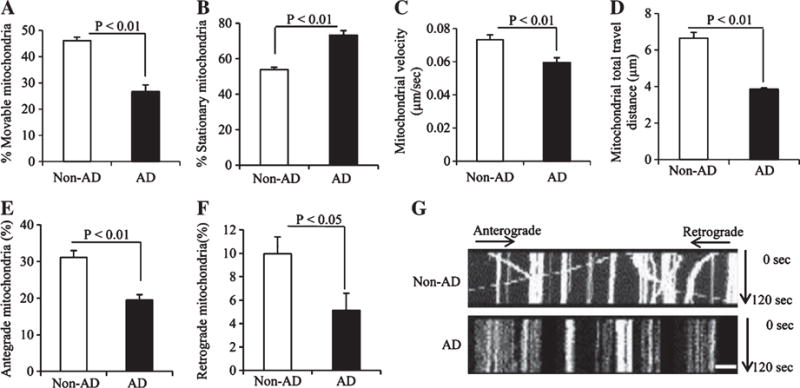
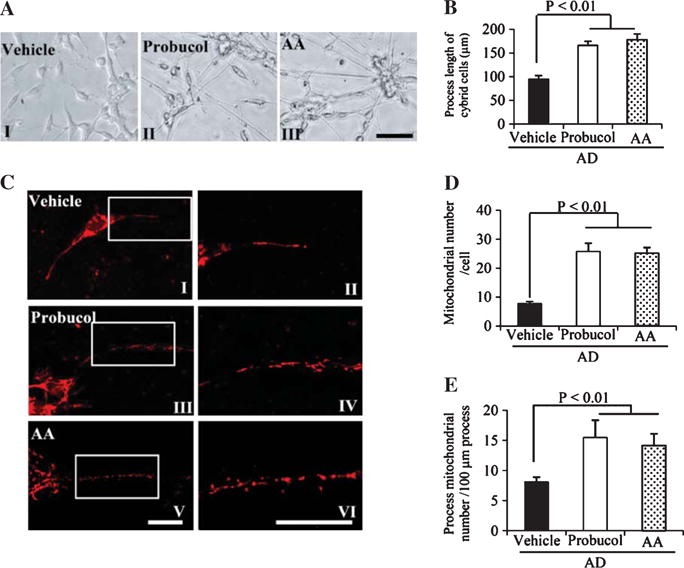
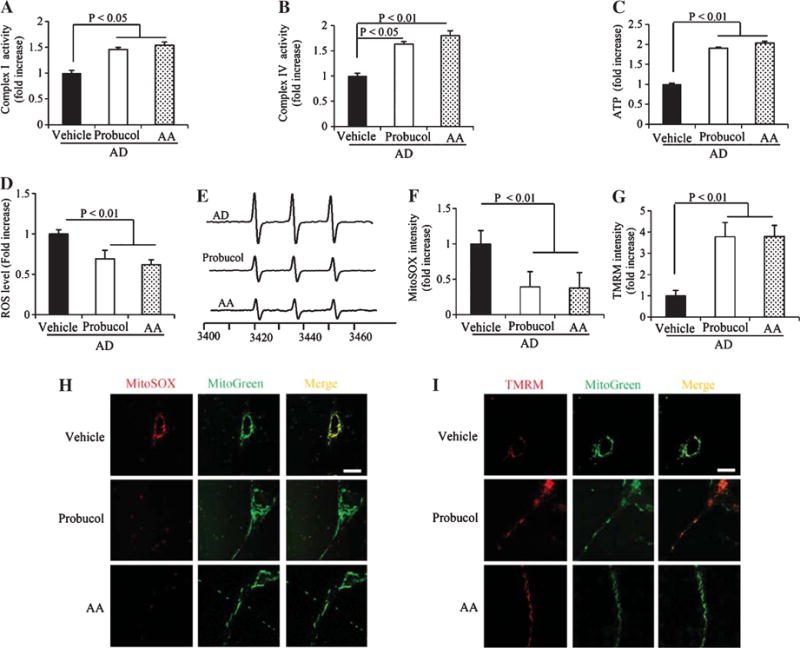
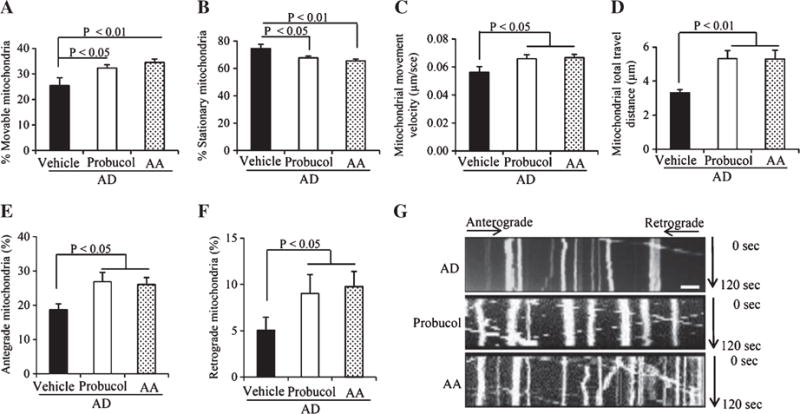
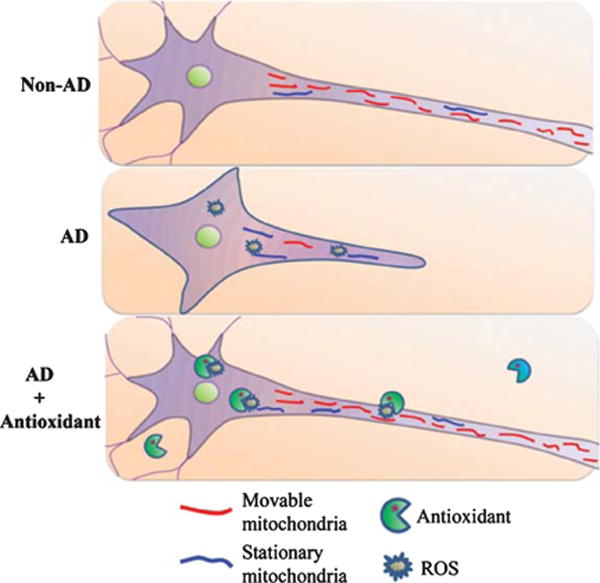
Mitochondrial dysfunction and axonal degeneration are early pathological features of Alzheimer's disease (AD)-affected brains. The underlying mechanisms and strategies to rescue it have not been well elucidated. Here, we evaluated axonal mitochondrial transport and function in AD subject-derived mitochondria. We analyzed mitochondrial transport and kinetics in human trans-mitochondrial "cybrid" (cytoplasmic hybrid) neuronal cells whose mitochondria were derived from platelets of patients with sporadic AD and compared these AD cybrid cell lines with cybrid cell lines whose mitochondria were derived from age-matched, cognitively normal subjects. Human AD cybrid cell lines, when induced to differentiate, developed stunted projections. Mitochondrial transport and function within neuronal processes/axons was altered in AD-derived mitochondria. Antioxidants reversed deficits in axonal mitochondrial transport and function. These findings suggest that antioxidants may be able to mitigate the consequences of AD-associated mitochondrial dysfunction. The present study provides evidence of the cause/effect of AD specific mitochondrial defects, which significantly enhances our understanding of the AD pathogenesis and exploring the effective therapeutic strategy for AD.
Keywords: Alzheimer’s disease; antioxidants; cybrid cells; mitochondrial dysfunction; mitochondrial transport.
Figures
Similar articles
-
Differentiated Alzheimer's disease transmitochondrial cybrid cell lines exhibit reduced organelle movement.Antioxid Redox Signal. 2005 Sep-Oct;7(9-10):1101-9. doi: 10.1089/ars.2005.7.1101. Antioxid Redox Signal. 2005. PMID: 16115014
-
Mitochondrial Dysfunction Triggers Synaptic Deficits via Activation of p38 MAP Kinase Signaling in Differentiated Alzheimer's Disease Trans-Mitochondrial Cybrid Cells.J Alzheimers Dis. 2017;59(1):223-239. doi: 10.3233/JAD-170283. J Alzheimers Dis. 2017. PMID: 28598851 Free PMC article.
-
Abnormal mitochondrial morphology in sporadic Parkinson's and Alzheimer's disease cybrid cell lines.Exp Neurol. 2000 Mar;162(1):37-50. doi: 10.1006/exnr.2000.7333. Exp Neurol. 2000. PMID: 10716887
-
Use of cytoplasmic hybrid cell lines for elucidating the role of mitochondrial dysfunction in Alzheimer's disease and Parkinson's disease.Ann N Y Acad Sci. 1999;893:176-91. doi: 10.1111/j.1749-6632.1999.tb07825.x. Ann N Y Acad Sci. 1999. PMID: 10672237 Review.
-
Mitochondrial traffic jams in Alzheimer's disease - pinpointing the roadblocks.Biochim Biophys Acta. 2016 Oct;1862(10):1909-17. doi: 10.1016/j.bbadis.2016.07.010. Epub 2016 Jul 25. Biochim Biophys Acta. 2016. PMID: 27460705 Review.
Cited by
-
Involvement of Lipids in Alzheimer's Disease Pathology and Potential Therapies.Front Physiol. 2020 Jun 9;11:598. doi: 10.3389/fphys.2020.00598. eCollection 2020. Front Physiol. 2020. PMID: 32581851 Free PMC article. Review.
-
Mitochondrial dysfunction and Alzheimer's disease: pathogenesis of mitochondrial transfer.Front Aging Neurosci. 2024 Dec 17;16:1517965. doi: 10.3389/fnagi.2024.1517965. eCollection 2024. Front Aging Neurosci. 2024. PMID: 39741520 Free PMC article. Review.
-
PINK1 Activation Attenuates Impaired Neuronal-Like Differentiation and Synaptogenesis and Mitochondrial Dysfunction in Alzheimer's Disease Trans-Mitochondrial Cybrid Cells.J Alzheimers Dis. 2021;81(4):1749-1761. doi: 10.3233/JAD-210095. J Alzheimers Dis. 2021. PMID: 33998543 Free PMC article.
-
SIRT1 prevents noise-induced hearing loss by enhancing cochlear mitochondrial function.Cell Commun Signal. 2025 Apr 2;23(1):160. doi: 10.1186/s12964-025-02152-9. Cell Commun Signal. 2025. PMID: 40176044 Free PMC article.
-
Mitochondria and Mitochondrial Cascades in Alzheimer's Disease.J Alzheimers Dis. 2018;62(3):1403-1416. doi: 10.3233/JAD-170585. J Alzheimers Dis. 2018. PMID: 29036828 Free PMC article. Review.
References
-
- Chan DC. Mitochondria: Dynamic organelles in disease, aging, and development. Cell. 2006;125:1241–1252. - PubMed
-
- Kann O, Kovacs R. Mitochondria and neuronal activity. Am J Physiol Cell Physiol. 2007;292:C641–C657. - PubMed
-
- Chen H, Chan DC. Critical dependence of neurons on mitochondrial dynamics. Curr Opin Cell Biol. 2006;18:453–459. - PubMed
-
- Hollenbeck PJ. The pattern and mechanism of mitochondrial transport in axons. Front Biosci. 1996;1:d91–d102. - PubMed
-
- Li Z, Okamoto K, Hayashi Y, Sheng M. The importance of dendritic mitochondria in the morphogenesis and plasticity of spines and synapses. Cell. 2004;119:873–887. - PubMed
Publication types
MeSH terms
Substances
Grants and funding
LinkOut - more resources
Full Text Sources
Other Literature Sources
Medical
