. 2016 Aug;9(4):313-21.
doi: 10.1016/j.tranon.2016.05.005.

Global Conservation of Protein Status between Cell Lines and Xenografts

Affiliations

Global Conservation of Protein Status between Cell Lines and Xenografts

Julian Biau et al. Transl Oncol. 2016 Aug.

Abstract

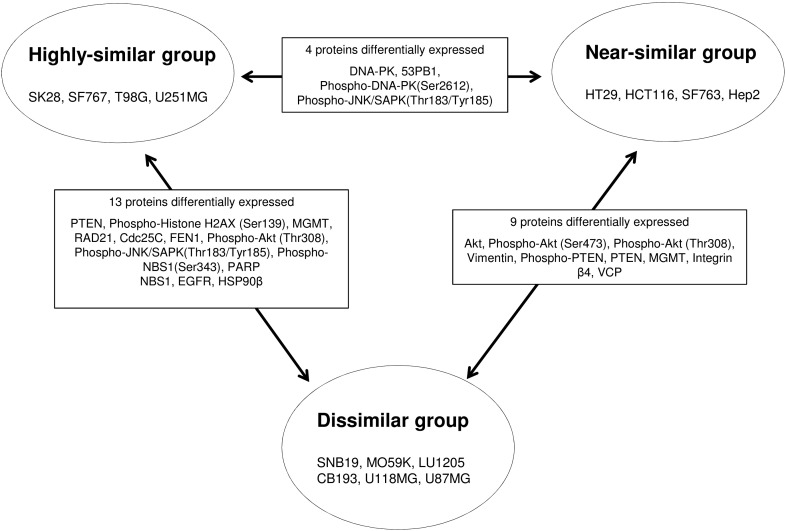
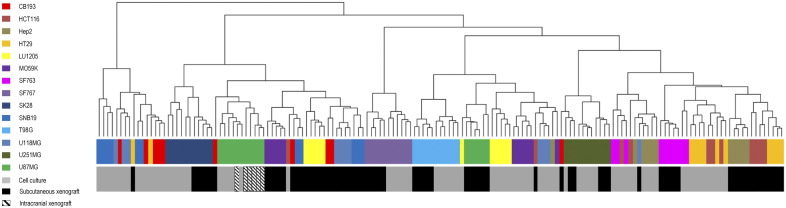
Common preclinical models for testing anticancer treatment include cultured human tumor cell lines in monolayer, and xenografts derived from these cell lines in immunodeficient mice. Our goal was to determine how similar the xenografts are compared with their original cell line and to determine whether it is possible to predict the stability of a xenograft model beforehand. We studied a selection of 89 protein markers of interest in 14 human cell cultures and respective subcutaneous xenografts using the reverse-phase protein array technology. We specifically focused on proteins and posttranslational modifications involved in DNA repair, PI3K pathway, apoptosis, tyrosine kinase signaling, stress, cell cycle, MAPK/ERK signaling, SAPK/JNK signaling, NFκB signaling, and adhesion/cytoskeleton. Using hierarchical clustering, most cell culture-xenograft pairs cluster together, suggesting a global conservation of protein signature. Particularly, Akt, NFkB, EGFR, and Vimentin showed very stable protein expression and phosphorylation levels highlighting that 4 of 10 pathways were highly correlated whatever the model. Other proteins were heterogeneously conserved depending on the cell line. Finally, cell line models with low Akt pathway activation and low levels of Vimentin gave rise to more reliable xenograft models. These results may be useful for the extrapolation of cell culture experiments to in vivo models in novel targeted drug discovery.


Figures

Figure S.1
Figure S.1
Heat map of all data. Data obtained for 14 cell lines were analyzed with five replicates for cell cultures and six replicates for subcutaneous xenograft models. For U87MG, an additional orthotopic model (six replicates) was studied. XG, xenograft; IC, intracranial xenograft.
Figure S.2
Figure S.2
Differentially expressed proteins between near-similar, highly similar, and dissimilar groups. Among the proteic markers explored, Mann-Whitney test was performed (P < .05) to identify makers differentially expressed between the three groups.
Figure 1
Figure 1
Hierarchical clustering of all data (cell line and xenograft). We explored a total of 89 proteic markers: 39 total proteins, 26 phosphoproteins, and 24 ratios of phosphoproteins on total proteins (Table S1). These proteins and modifications were chosen as representative of DNA repair, PI3K pathway, apoptosis, tyrosine kinase signaling, stress signaling, cell cycle, MAPK/ERK signaling, SAPK/JNK signaling, NFκB signaling, and adhesion/cytoskeleton. Data obtained for 14 cell lines were analyzed with 5 replicates for cell cultures and 6 replicates for subcutaneous xenograft models. For U87MG, an additional orthotopic model (six replicates) was studied. The dendrogram was built using Ward method.
Figure 2
Figure 2
Hierarchical clustering of in vitro data. The mean values obtained for each explored protein or phosphoprotein for the 14 cell lines were used to build the dendrogram (Ward method). The first cluster corresponds to the dissimilar group. The second combines the near-similar and highly similar groups, called here the similar group.
Figure 3
Figure 3
Differentially expressed proteins between similar and dissimilar groups. Among the proteic markers explored, Mann-Whitney test was performed (P < .05) to identify makers differentially expressed between the two groups of models. Boxplots for identified markers and fold change between similar and dissimilar groups are indicated.
Figure 4
Figure 4
Heat map of differentially expressed proteins between similar and dissimilar groups. Expression range from low (white) to high (black) for the 11 differentially expressed markers between the similar (green) and dissimilar groups (blue).

References

    1. Hughes J, Rees S, Kalindjian S, Philpott K. Principles of early drug discovery. Br J Pharmacol. 2011;162:1239–1249. - PMC - PubMed
    1. Stylli SS, Luwor RB, Ware TMB, Tan F, Kaye AH. Mouse models of glioma. J Clin Neurosci. 2015;22:619–626. - PubMed
    1. Marx V. Models: stretching the skills of cell lines and mice. Nat Methods. 2014;11:617–620. - PubMed
    1. Hickman JA, Graeser R, de Hoogt R, Vidic S, Brito C, Gutekunst M, van der Kuip H. IMI PREDECT Consortium. Three-dimensional models of cancer for pharmacology and cancer cell biology: capturing tumor complexity in vitro/ex vivo. Biotechnol J. 2014;9:1115–1128. - PubMed
    1. Gazdar AF, Girard L, Lockwood WW, Lam WL, Minna JD. Lung cancer cell lines as tools for biomedical discovery and research. J Natl Cancer Inst. 2010;102:1310–1321. - PMC - PubMed