IDH1 Associated with Neuronal Apoptosis in Adult Rats Brain Following Intracerebral Hemorrhage
- PMID: 27568302
- PMCID: PMC11482103
- DOI: 10.1007/s10571-016-0421-9
IDH1 Associated with Neuronal Apoptosis in Adult Rats Brain Following Intracerebral Hemorrhage
Abstract
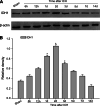
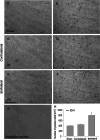
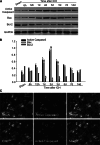
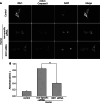
Isocitrate dehydrogenase 1 (IDH1), one member of the IDH family can convert isocitrate to α-ketoglutarate (α-KG) via oxidative decarboxylation. IDH1 and IDH2 mutations have been identified in multiple tumor types and the mutations confer neomorphic activity in the mutant protein, resulting in the conversion of α-KG to the oncometabolite, D-2-hydroxyglutarate (2-HG). The subsequent accumulation of 2-HG results in epigenetic dysregulation via inhibition of α-KG-dependent histone and DNA demethylase. And the glutamate levels are reduced in IDH mutant cells compared to wild-type. We have known that diffuse gliomas contain a high frequency of mutations in the IDH1 gene. However, the expression of IDH1 and its roles in Intracranial hemorrhage (ICH) remain largely unknown. We observed increased expression of IDH1 in neurons after intracerebral hemorrhage. Up-regulation of IDH1 was found to be accompanied by the increased expression of active caspase-3 and pro-apoptotic Bcl-2-associated X protein and decreased expression of anti-apoptotic protein B cell lymphoma-2 in vivo and vitro studies. So we hypothesized that IDH1 was involved in the regulation of neuronal apoptosis. The present research for the first time detected the expression and variation of IDH1 surrounding the hematoma, and all data proved the involvement of IDH1 in neuronal apoptosis following ICH.
Keywords: Active caspase-3; Apoptosis; ICH; IDH1; Neuron.
Conflict of interest statement
The authors have declared that no conflict of interest exists.
Figures


Similar articles
-
The member of high temperature requirement family HtrA2 participates in neuronal apoptosis after intracerebral hemorrhage in adult rats.J Mol Histol. 2013 Aug;44(4):369-79. doi: 10.1007/s10735-013-9489-4. Epub 2013 Feb 15. J Mol Histol. 2013. PMID: 23413020
-
Upregulated expression of SSTR1 is involved in neuronal apoptosis and is coupled to the reduction of bcl-2 following intracerebral hemorrhage in adult rats.Cell Mol Neurobiol. 2014 Oct;34(7):951-61. doi: 10.1007/s10571-014-0081-6. Epub 2014 Jul 18. Cell Mol Neurobiol. 2014. PMID: 25035058 Free PMC article.
-
OTUB1 attenuates neuronal apoptosis after intracerebral hemorrhage.Mol Cell Biochem. 2016 Nov;422(1-2):171-180. doi: 10.1007/s11010-016-2817-8. Epub 2016 Sep 15. Mol Cell Biochem. 2016. PMID: 27629786
-
IDH mutations in cancer and progress toward development of targeted therapeutics.Ann Oncol. 2016 Apr;27(4):599-608. doi: 10.1093/annonc/mdw013. Ann Oncol. 2016. PMID: 27005468 Review.
-
Biological Significance of Mutant Isocitrate Dehydrogenase 1 and 2 in Gliomagenesis.Neurol Med Chir (Tokyo). 2016;56(4):170-9. doi: 10.2176/nmc.ra.2015-0322. Epub 2016 Mar 10. Neurol Med Chir (Tokyo). 2016. PMID: 26960449 Free PMC article. Review.
Cited by
-
Chronic Oxidative Stress, Mitochondrial Dysfunction, Nrf2 Activation and Inflammation in the Hippocampus Accompany Heightened Systemic Inflammation and Oxidative Stress in an Animal Model of Gulf War Illness.Front Mol Neurosci. 2017 Jun 14;10:182. doi: 10.3389/fnmol.2017.00182. eCollection 2017. Front Mol Neurosci. 2017. PMID: 28659758 Free PMC article.
-
Programmed Cell Death after Intracerebral Hemorrhage.Curr Neuropharmacol. 2018;16(9):1267-1281. doi: 10.2174/1570159X15666170602112851. Curr Neuropharmacol. 2018. PMID: 28571544 Free PMC article. Review.
-
Isolation of microglia-derived extracellular vesicles: towards miRNA signatures and neuroprotection.J Nanobiotechnology. 2019 Dec 4;17(1):119. doi: 10.1186/s12951-019-0551-6. J Nanobiotechnology. 2019. PMID: 31801555 Free PMC article.
-
The Role of Smurf1 in Neuronal Necroptosis after Lipopolysaccharide-Induced Neuroinflammation.Cell Mol Neurobiol. 2018 May;38(4):809-816. doi: 10.1007/s10571-017-0553-6. Epub 2017 Sep 22. Cell Mol Neurobiol. 2018. PMID: 28940129 Free PMC article.
References
MeSH terms
Substances
LinkOut - more resources
Full Text Sources
Other Literature Sources
Medical
Research Materials
Miscellaneous

