. 2016 Sep 13;24(3):402-419.
doi: 10.1016/j.cmet.2016.08.002. Epub 2016 Aug 25.

Beige Adipocyte Maintenance Is Regulated by Autophagy-Induced Mitochondrial Clearance

Affiliations

Beige Adipocyte Maintenance Is Regulated by Autophagy-Induced Mitochondrial Clearance

Svetlana Altshuler-Keylin et al. Cell Metab. .

Abstract

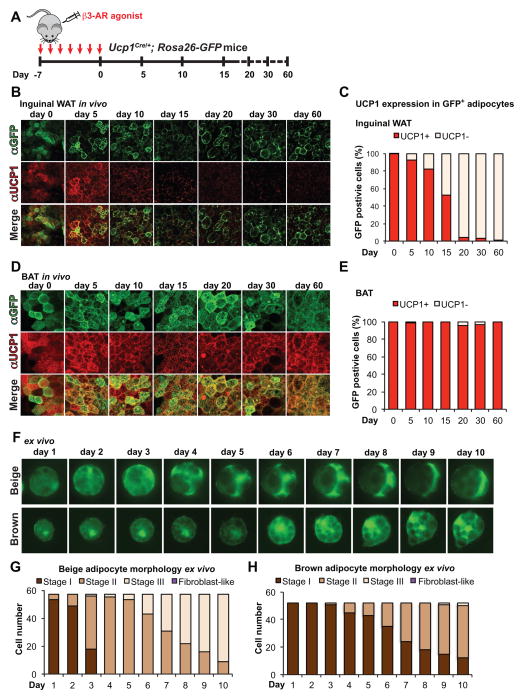
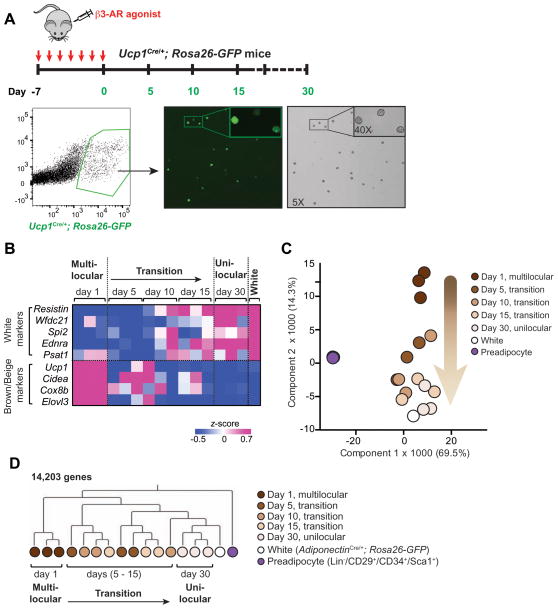
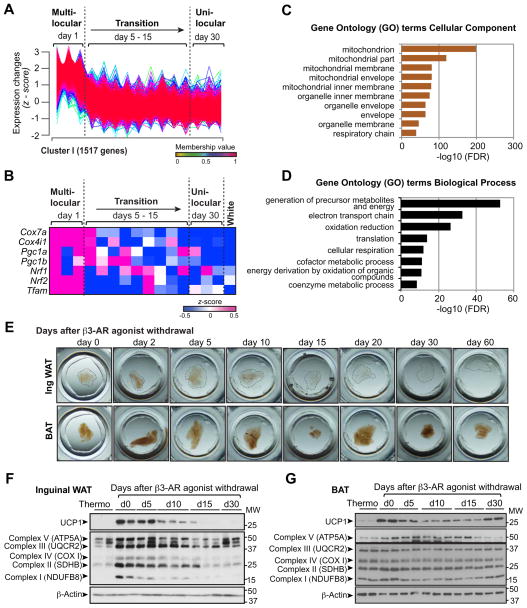
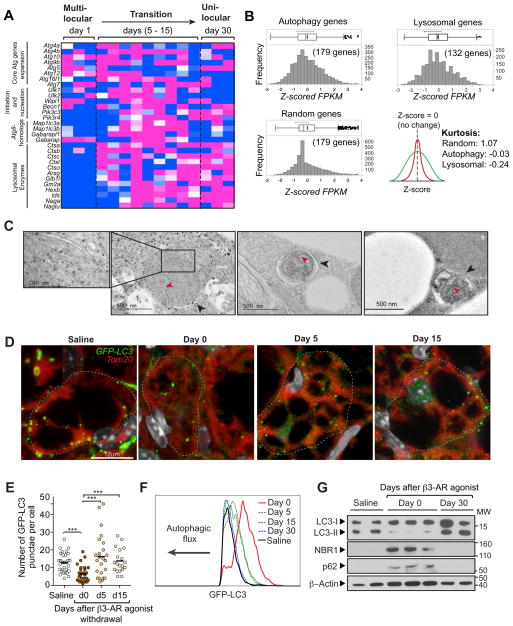
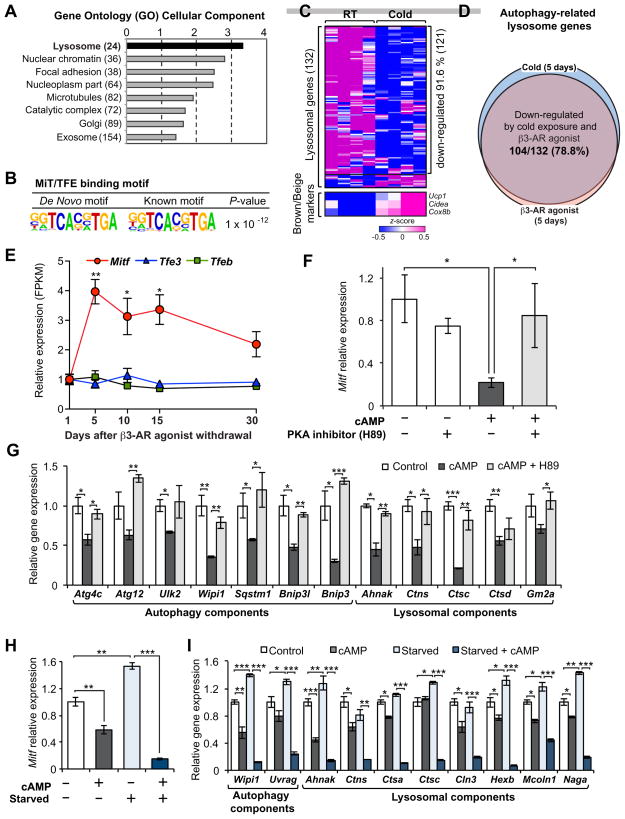
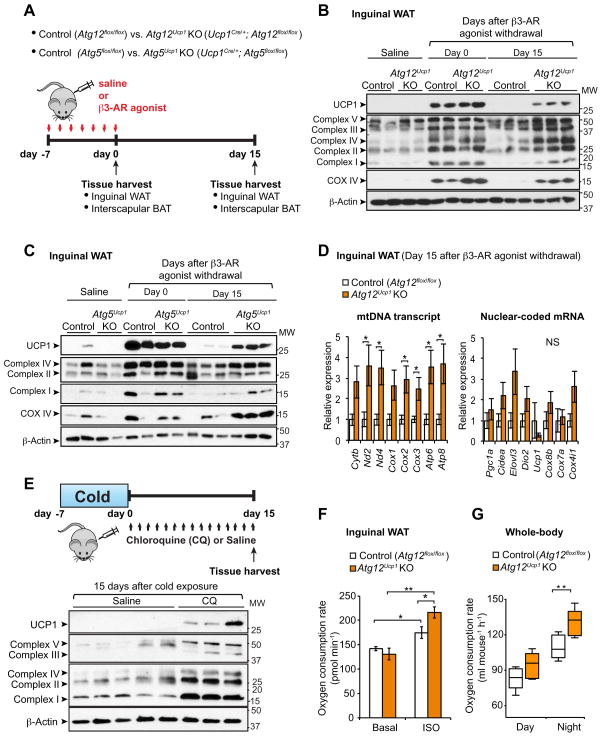
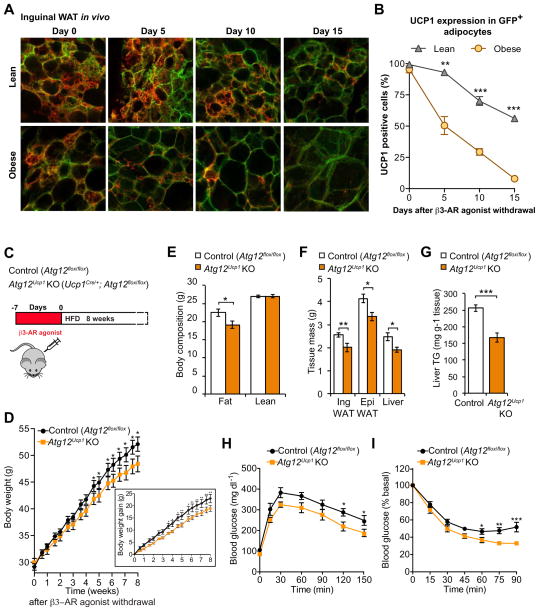
Beige adipocytes gained much attention as an alternative cellular target in anti-obesity therapy. While recent studies have identified a number of regulatory circuits that promote beige adipocyte differentiation, the molecular basis of beige adipocyte maintenance remains unknown. Here, we demonstrate that beige adipocytes progressively lose their morphological and molecular characteristics after withdrawing external stimuli and directly acquire white-like characteristics bypassing an intermediate precursor stage. The beige-to-white adipocyte transition is tightly coupled to a decrease in mitochondria, increase in autophagy, and activation of MiT/TFE transcription factor-mediated lysosome biogenesis. The autophagy pathway is crucial for mitochondrial clearance during the transition; inhibiting autophagy by uncoupled protein 1 (UCP1(+))-adipocyte-specific deletion of Atg5 or Atg12 prevents beige adipocyte loss after withdrawing external stimuli, maintaining high thermogenic capacity and protecting against diet-induced obesity and insulin resistance. The present study uncovers a fundamental mechanism by which autophagy-mediated mitochondrial clearance controls beige adipocyte maintenance, thereby providing new opportunities to counteract obesity.

Keywords: beige adipocytes; diabetes; mitochondria; mitophagy; obesity.


Figures

Figure 1
Figure 1. Beige adipocytes directly acquire morphological characteristics of white adipocytes after withdrawing external stimuli
(A) Schematic illustration of experiments to track beige adipocytes in vivo. Ucp1Cre/+;Rosa26-GFP reporter mice were treated with the β3-AR agonist CL316,243 at 1mg kg−1 for seven consecutive days. Interscapular BAT and inguinal WAT depots were harvested for morphological and molecular analyses at the indicated time points after β3-AR agonist withdrawal. (B) Immunohistochemistry for GFP and endogenous UCP1 expression in the inguinal WAT from Ucp1Cre/+;Rosa26-GFP reporter mice. Inguinal WAT depots were harvested at indicated time points after β3-AR agonist withdrawal. Scale bar, 70 μm. (C) Quantification of GFP-positive adipocytes that express endogenous UCP1 in (B). n = 150 cells or more per group. (D) Immunohistochemistry for GFP and endogenous UCP1 expression in the interscapular BAT from Ucp1Cre/+; Rosa26-GFP reporter mice. BAT depots were harvested at indicated time points after β3-AR agonist withdrawal. Scale bar, 40 μm. (E) Quantification of GFP-positive adipocytes that express endogenous UCP1 in (D). n = 127 cells or more per group. (F) Morphological changes of beige adipocytes (top panel) and classical brown adipocytes (bottom panel) using the single-cell monitoring system. GFP-positive beige or brown adipocytes were isolated from Ucp1Cre/+;Rosa26-GFP reporter mice treated with the β3-AR agonist CL316,243 for seven days. Morphology of the individual GFP-positive adipocytes was monitored for 10 consecutive days. Scale bar, 70 μm. (G) Quantification of GFP-positive beige adipocytes in (F, top panel). Stage of each cell was estimated based on the criteria shown in Figure S2B and C. n = 57 cells. (H) Quantification of GFP-positive classical brown adipocytes in (F, bottom panel). n = 55 cells.
Figure 2
Figure 2. Beige adipocytes directly acquire molecular characteristics of white adipocytes after withdrawing external stimuli
(A) Top panel: Schematic illustration for isolating GFP-positive adipocytes by FACS at the indicated time points in the inguinal WAT of Ucp1Cre/+;Rosa26-GFP reporter mice. Bottom panel: Gating strategy for isolating GFP-positive adipocytes. GFP positive adipocytes were visualized after sorting at day 1 of β3-AR agonist withdrawal. Note that all the FACS-isolated cells (bright-field) express GFP and that all of the GFP positive cells from day 1 of β3-AR agonist withdrawal contained multilocular lipids. (B) Expression profiles of the WAT-enriched genes and brown/beige fat-enriched genes in the GFP-positive FACS-isolated beige adipocytes at indicated time points after β3-AR agonist withdrawal as described in (A). The color scale shows z-scored FPKM representing the mRNA level of each gene in blue (low expression)-white-red (high expression) scheme. Gene expression in the white adipocytes FACS-isolated from the inguinal fat pad of age-matched AdiponectinCre/+;Rosa26-GFP reporter mice is shown in the right column. (C) Principal component analysis (PCA) of transcriptome in FACS-isolated beige adipocytes (Ucp1Cre/+;Rosa26-GFP), FACS-isolated white adipocytes (AdiponectinCre/+;Rosa26-GFP), and undifferentiated adipocyte precursors (Lin/CD34+/CD29+/Sca1+) from the SV fraction of inguinal WAT of age-matched wild-type mice. The number in parentheses represents the proportion of data variance explained by each PC. (D) Hierarchical clustering of beige adipocytes, white adipocytes, and undifferentiated adipocyte precursors. The clustering was generated based on the RNA-sequencing data of GFP-positive beige adipocytes at day 1 of β3-AR agonist withdrawal (multi-locular state), at days 5, 10, and 15 of withdrawal (transition phase), and at day 30 of withdrawal (unilocular state). White adipocytes and undifferentiated precursors are shown in white and purple circles, respectively. The clustering was visualized by MeV. The horizontal distance represents similarities among each cluster.
Figure 3
Figure 3. Beige-to-white adipocyte transition is accompanied by mitochondrial clearance
(A) Gene expression profile of 1,517 genes that belongs to Cluster I during the beige-to-white adipocyte transition. Y-axis represents expression changes in the expression level (z-scored FPKM) of each gene. Gene expression profiles of other clusters are shown in Figure S3A. (B) Expression profiles of brown/beige-enriched mitochondrial genes (Cox7a and Cox4i1) and key transcriptional regulators of mitochondrial biogenesis (Pgc1a, Pgc1b, Nrf1/2, and Tfam) in the GFP-positive adipocytes at indicated time points after β3-AR agonist withdrawal. The color scale shows z-scored FPKM representing the mRNA level of each gene in blue (low expression)-white-red (high expression) scheme. Gene expression in the white adipocytes isolated from AdiponectinCre/+;Rosa26-GFP reporter mice is shown in the right column. n = 3 for each time point of beige-to-white transition. (C) GO analysis (cellular component) of the genes in Cluster I (GO FAT). (D) GO analysis (biological process) of the genes in Cluster I (GO FAT). (E) Inguinal WAT and BAT depots (3–5mm diameter) at indicated time points after β3-AR agonist withdrawal were fixed in 4% PFA and cleared for optical imaging. (F) Immunoblotting for UCP1 and the indicate mitochondrial complex components in the inguinal WAT depots of wild-type mice under thermoneutrality and at indicated time points (days 0 – 30) following β3-AR agonist withdrawal. β-actin was used as a loading control. Molecular weight (MW) is shown on the right. (G) Immunoblotting for UCP1 and the indicate mitochondrial complex components in the interscapular BAT depots of wild-type mice in (F).
Figure 4
Figure 4. Activation of autophagy during the beige-to-white adipocyte transition
(A) Expression profile of the autophagy-related genes during the beige-to-white adipocyte transition. The color scale shows z-scored FPKM representing the mRNA level of each gene in blue (low expression)-white-red (high expression) scheme. n = 3 for each time point. (B) Kurtosis of the autophagy and lysosomal genes in (A). Note that the autophagy and lysosome component genes were platykurtic (K= −0.03 and −0.24, respectively), while randomly selected genes showed mesokurtic distribution (K= 1.07). (C) Electron microscopy images of beige adipocytes during the transition (days 5 – 30 following β3-AR agonist withdrawal). Black arrowheads indicate the autophagic vesicles containing mitochondrial remnants, as identified by remaining cristae (red arrowheads). Scale bar, 500 nm. (D) Confocal microscopy images of beige adipocytes from GFP-LC3 mice. GFP-LC3 mice were treated with saline or the β3-AR agonist CL316,243 for seven consecutive days. The inguinal WAT depots were harvested at indicated time points (days 0 – 15) following β3-AR agonist withdrawal. Mitochondria and GFP-LC3-labelled autophagosomes were visualized by immunohistochemistry for Tom20 (red) and GFP (green), respectively. Nuclei are labeled with Hoechst (grey). The image in inset shows co-localization of GFP-LC3 and mitochondria. Scale bar, 12 μm. (E) Quantification of the GFP-LC3 puncta in (A) at indicated time points. *** P <0.001 by Mann-Whitney U test. n = 20–30 cells per condition. (F) Autophagic flux in adipocytes from GFP-LC3 mice at indicated time points (days 0 – 30) following β3-AR agonist withdrawal (beige adipocytes) and from GFP-LC3 mice treated with saline (white adipocytes). X-axis represents GFP-LC3 fluorescence intensity and Y-axis represents the number of adipocytes normalized to mode. Data are representatives of two independent experiments. (G) Immunoblotting for NBR1, p62/SQSTM1, and LC3 (LC3-I and LC3-II) from lysates of adipocytes isolated from the inguinal WAT of wild-type mice treated with saline or the β3-AR agonist CL316,243 (day 0 and 30 following β3-AR agonist withdrawal). β-actin was used as a loading control. Data are representatives of 3 independent experiments. Molecular weight (MW) is shown on the right.
Figure 5
Figure 5. Regulation of autophagy-related lysosome biogenesis through the MiT/TFE transcription factors during the beige-to-white adipocyte transition
(A) GO analysis (cellular component) of the genes that were transiently activated during the beige-to-white adipocyte transition (Cluster 2). (B) The HOMER-based motif analysis of lysosome genes in (A). (C) Expression of lysosome marker genes in the inguinal WAT of mice housed under cold or ambient temperature for 5 days. FPKM values were converted to z-score and visualized in blue (low)–white (no change)–red (high) color scheme. n=5. (D) Regulation of the autophagy-related lysosome genes by cold exposure (shown in C) and by chronic β3-AR agonist treatment for 5 days. Note that 78.8% of the autophagy-related lysosome genes (104 out of 132 genes) were down-regulated both by cold exposure and β3-AR agonist. (E) Relative expression of MiT/TFE members of transcription factors (Mitf, Tfe3, and Tfeb) during the beige-to-white adipocyte transition. * P <0.05, ** P <0.01 by two-tailed Student’s t-test. n = 3. Data are expressed as means ± s.e.m as compared to day 1 after β3-AR agonist treatment. (F) Regulation of Mitf mRNA expression in response to cAMP in the presence or absence of a PKA inhibitor H89. Differentiated beige adipocytes were treated with by 10 μM forskolin (cAMP) for 4hr in the presence or absence of H89 at a dose of 10 μM. H89 was added 1 hr prior to forskolin treatment. * P <0.05, by two-tailed Student’s t-test. n = 3. Data are expressed as means ± s.e.m. (G) mRNA expression of autophagy components that are known targets of MiT/TFE transcription factors. * P <0.05, ** P <0.01, *** P <0.001 by two-tailed Student’s t-test. n = 3. Data are expressed as means ± s.e.m. (H) Regulation of Mitf mRNA expression in response to cAMP in a regular medium or amino acid depletion medium (starved). Differentiated beige adipocytes were cultured in amino acid free medium supplemented with 10% dialyzed serum for 4hr prior to forskolin (cAMP) treatment (10 μM, 4hr). ** P <0.01, *** P <0.001 by two-tailed Student’s t-test. n = 3. Data are expressed as means ± s.e.m. (I) mRNA expression of the MI/TFE-target autophagy-related genes in response to cAMP under a fed or fasted state. * P <0.05, ** P <0.01, *** P <0.001 by two-tailed Student’s t-test. n = 3. Data are expressed as means ± s.e.m.
Figure 6
Figure 6. Genetic ablation of Atg12 or Atg5 maintains beige adipocyte characteristics after removal of β3-AR agonist
(A) Schematic illustration of experiments. Control (Atg12flox/flox or Atg5flox/flox), Atg12Ucp1 KO (Ucp1Cre/+;Atg12flox/flox), and Atg5Ucp1 KO (Ucp1Cre/+;Atg5flox/flox) mice were treated with the β3-AR agonist CL316,243 for seven consecutive days. Interscapular BAT and inguinal WAT depots were harvested for molecular analyses at day 0 and 15 following β3-AR agonist withdrawal. (B) Immunoblotting for UCP1 and mitochondrial complexes (as indicated) in the inguinal WAT depots of control (Atg12flox/flox) and Atg12Ucp1 KO mice at day 0 and day 15 following β3-AR agonist withdrawal. Inguinal WAT depots from control and Atg12Ucp1 KO mice treated with saline were included as a reference of basal expression of UCP1 and mitochondrial complexes. β-actin was used as a loading control. Molecular weight (MW) is shown on the right. (C) Immunoblotting for UCP1 and mitochondrial complexes (as indicated) in the inguinal WAT depots of control (Atg5flox/flox) and Atg5Ucp1 KO mice. Samples were harvested as illustrated in (B) (D) Left; Mitochondrial DNA (mtDNA) transcripts (as indicated) were quantified in the inguinal WAT depots of control and Atg12Ucp1 KO mice at day 15 following β3-AR agonist withdrawal. Right; mRNA levels of nuclear-coded beige-enriched markers (as indicated) are shown. * P <0.05 by two-tailed Student’s t-test. n = 5. Data are expressed as means ± s.e.m. (E) Top panel: Wild-type mice were housed at 6°C for 7 days and subsequently kept under thermoneutrality (30°C) for 15 days. During the re-warming period, the mice were treated with chloroquine at a dose of 60 mg kg−1 or saline. Inguinal WAT depots were harvested for molecular analysis. Bottom panel; Immunoblotting for UCP1 and mitochondrial complexes (as indicated) in the Inguinal WAT of mice. Molecular weight (MW) is shown on the right. (F) Oxygen consumption rate (OCR) in the inguinal WAT depots of control and Atg12Ucp1 KO mice at day 15 following β3-AR agonist withdrawal. The isolated tissues were treated with isoproterenol or vehicle (basal). OCR data were shown per 1 mg of tissue. * P < 0.05, ** P < 0.01 by two-tailed Student’s t-test. n = 4. Data are expressed as means ± s.e.m. (G) Quantification of whole-body oxygen consumption rate (VO2) of control and Atg12Ucp1 KO mice during day 17–18 following β3-AR agonist withdrawal. VO2 was measured by CLAMS during day and night time. ** P <0.01 by two-tailed Student’s t-test. n = 5 per genotype. Data are expressed as means ± s.e.m.
Figure 7
Figure 7. Prolonged maintenance of beige adipocytes by autophagy inhibition protects animals from diet-induced obesity and insulin resistance
(A) Confocal images of fixed inguinal WAT sections from Ucp1Cre/+;mT/mG reporter mice. Inguinal WAT depots from lean mice under a regular diet (top panel) and age-matched obese mice under a high-fat diet (bottom panel) were immunostained for endogenous UCP1 (Red). Note that the cellular membranes of beige adipocytes were visualized by membrane-targeted GFP (mGFP, Green) of the mT/mG reporter mice. Scale bar, 57 μm. (B) Quantification of mGFP-positive adipocytes in lean and obese mice that express endogenous UCP1 in (A). n = 100 cells or more per group. ** P <0.01, *** P <0.001 by two-tailed Student’s t-test. (C) Schematic of the metabolic experiment in control (Atg12flox/flox) and Atg12Ucp1 KO mice. Control and Atg12Ucp1 KO mice were treated with CL316,243 for seven days to induce beige adipocyte biogenesis. Subsequently, the mice were acclimated to thermoneutrality (30 °C) under a high-fat diet for 8 weeks. (D) Body weight of control (Atg12flox/flox) and Atg12Ucp1 KO mice under a high-fat diet. Body weight was measured twice a week. * P <0.05, ** P <0.01. n = 8 – 10 per genotype. The graph in the inset shows body weight gain of control and Atg12Ucp1 KO mice. Significance was determined by two-way repeated-measures ANOVA followed by Fisher’s LSD test. Data are expressed as means ± s.e.m. (E) Body composition of control (Atg12flox/flox) and Atg12Ucp1 KO mice from (D) at the end of 8 weeks of high-fat diet. * P <0.05 by two-tailed Student’s t-test. Data are expressed as means ± s.e.m. (F) Tissue weight of inguinal WAT, epididymal WAT, and liver from control (Atg12flox/flox) and Atg12Ucp1 KO mice from (D) after 9 weeks of high fat diet. * P <0.05, ** P <0.01. Data are expressed as means ± s.e.m. (G) Liver triglyceride levels in control (Atg12flox/flox) and Atg12Ucp1 KO mice after 9 weeks of high fat diet. *** P <0.001. Data are expressed as means ± s.e.m. (H) After 8 weeks of high-fat diet, control (Atg12flox/flox) and Atg12Ucp1 KO mice were fasted for 12 hours and injected with 1.5g kg−1 glucose. Whole-body glucose was measured at 15, 30, 60, 90, 120, and 150 min. * P <0.05, n = 6 – 8 per genotype. Significance was determined by two-way repeated-measures ANOVA followed by Fisher’s LSD test. Data are expressed as means ± s.e.m. (I) After 8.5 weeks of high fat diet diet, control (Atg12flox/flox) and Atg12Ucp1 KO mice were fasted for 3 hours and injected with 0.75 U kg−1 insulin. Whole-body glucose was measured at 15, 30, 45, 60, 75, and 90 min. * P <0.05, ** P <0.01, *** P <0.001, n = 7–8 per genotype. Significance was determined by two-way repeated-measures ANOVA followed by Fisher’s LSD test. Data are expressed as means ± s.e.m.

Comment in

References

    1. Atit R, Sgaier SK, Mohamed OA, Taketo MM, Dufort D, Joyner AL, Niswander L, Conlon RA. Beta-catenin activation is necessary and sufficient to specify the dorsal dermal fate in the mouse. Developmental biology. 2006;296:164–176. - PubMed
    1. Barbatelli G, Murano I, Madsen L, Hao Q, Jimenez M, Kristiansen K, Giacobino JP, De Matteis R, Cinti S. The emergence of cold-induced brown adipocytes in mouse white fat depots is determined predominantly by white to brown adipocyte trans differentiation. American journal of physiology. 2010;298:E1244–1253. - PubMed
    1. Bi P, Shan T, Liu W, Yue F, Yang X, Liang XR, Wang J, Li J, Carlesso N, Liu X, et al. Inhibition of Notch signaling promotes browning of white adipose tissue and ameliorates obesity. Nature medicine. 2014;20:911–918. - PMC - PubMed
    1. Bowman CJ, Ayer DE, Dynlacht BD. Foxk proteins repress the initiation of starvation-induced atrophy and autophagy programs. Nature cell biology. 2014;16:1202–1214. - PMC - PubMed
    1. Cederberg A, Gronning LM, Ahren B, Tasken K, Carlsson P, Enerback S. FOXC2 is a winged helix gene that counteracts obesity, hypertriglyceridemia, and diet-induced insulin resistance. Cell. 2001;106:563–573. - PubMed

Publication types

MeSH terms

Substances