. 2016 Sep 6;16(10):2723-2735.
doi: 10.1016/j.celrep.2016.08.002. Epub 2016 Aug 25.

NGF-TrkA Signaling by Sensory Nerves Coordinates the Vascularization and Ossification of Developing Endochondral Bone

Affiliations

NGF-TrkA Signaling by Sensory Nerves Coordinates the Vascularization and Ossification of Developing Endochondral Bone

Ryan E Tomlinson et al. Cell Rep. .

Abstract

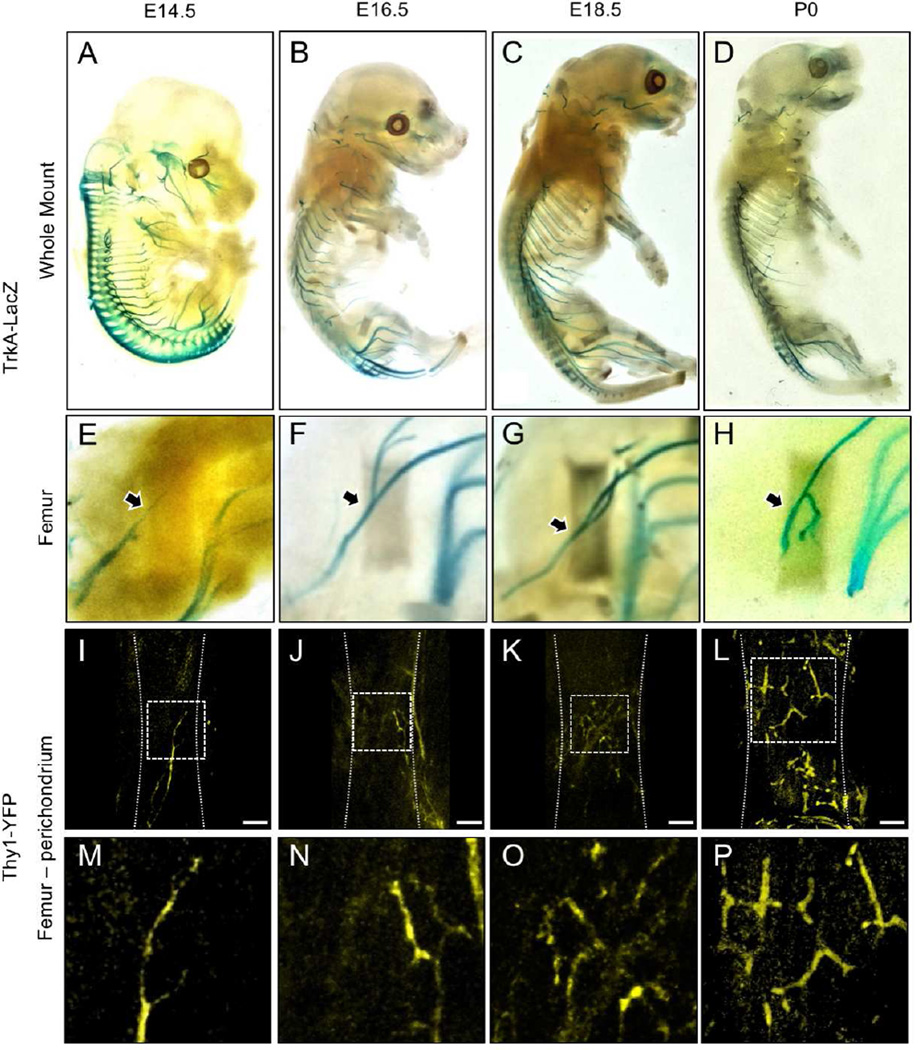
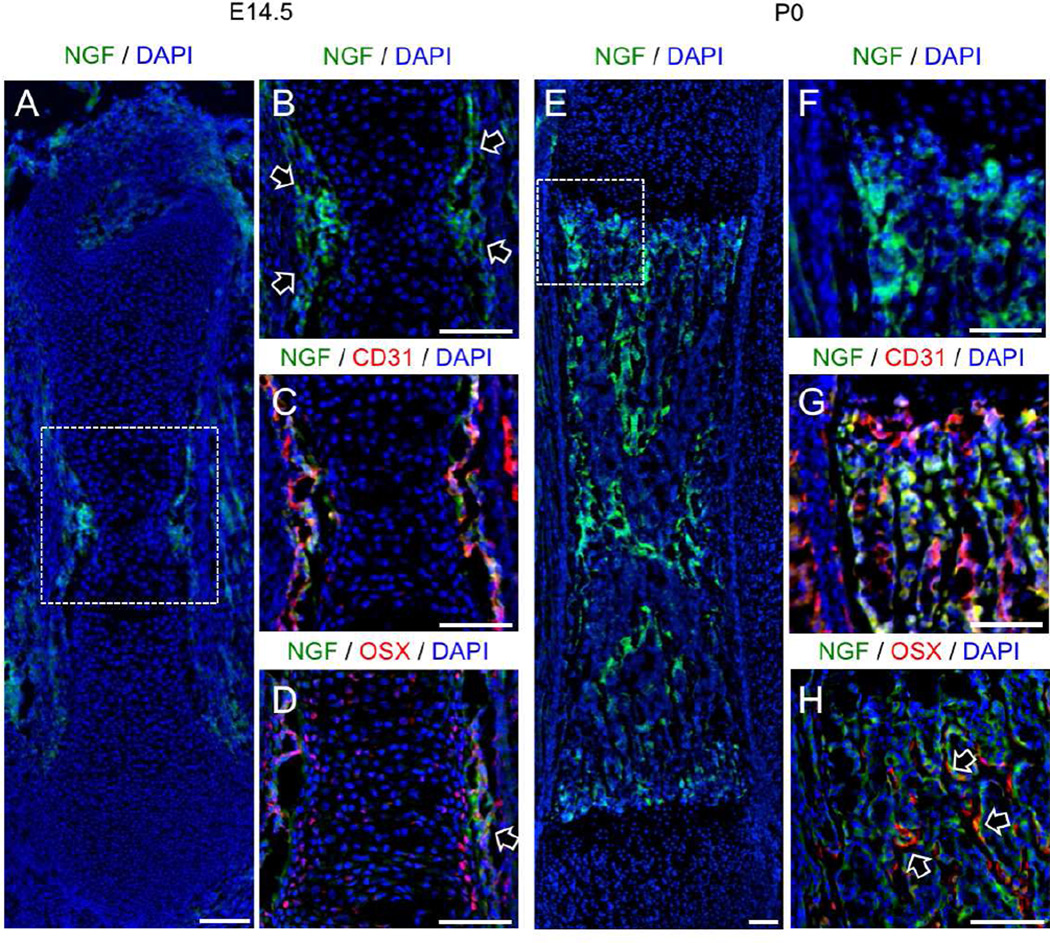
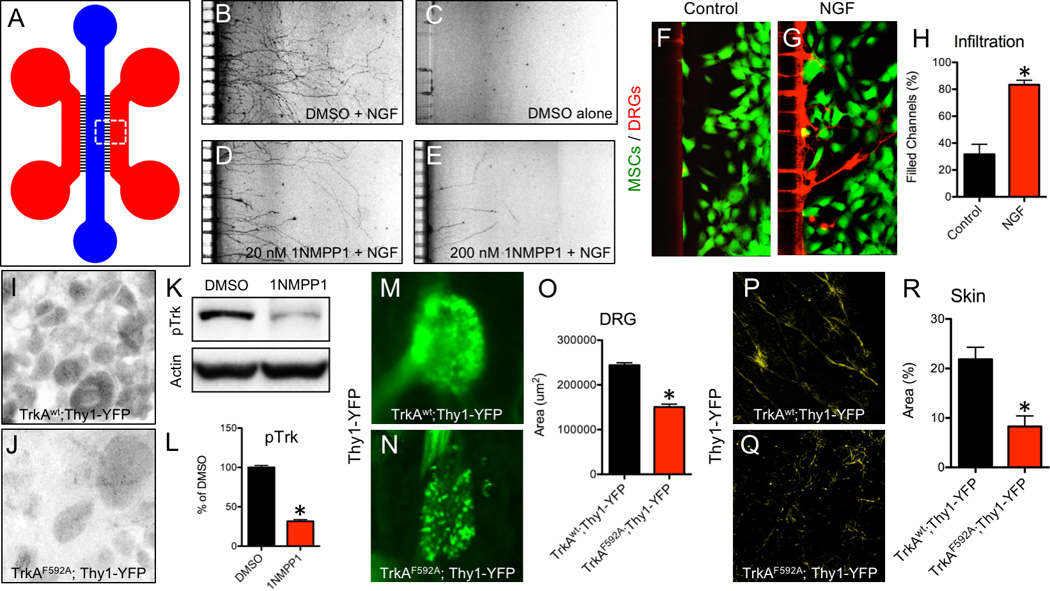
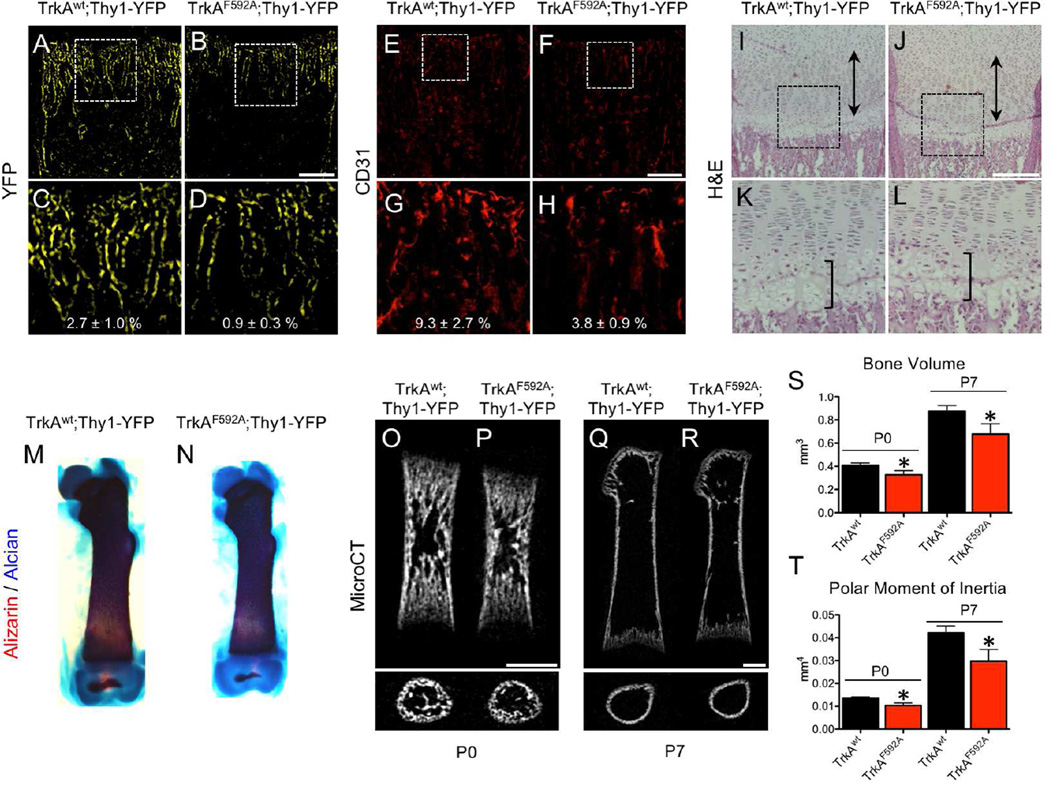
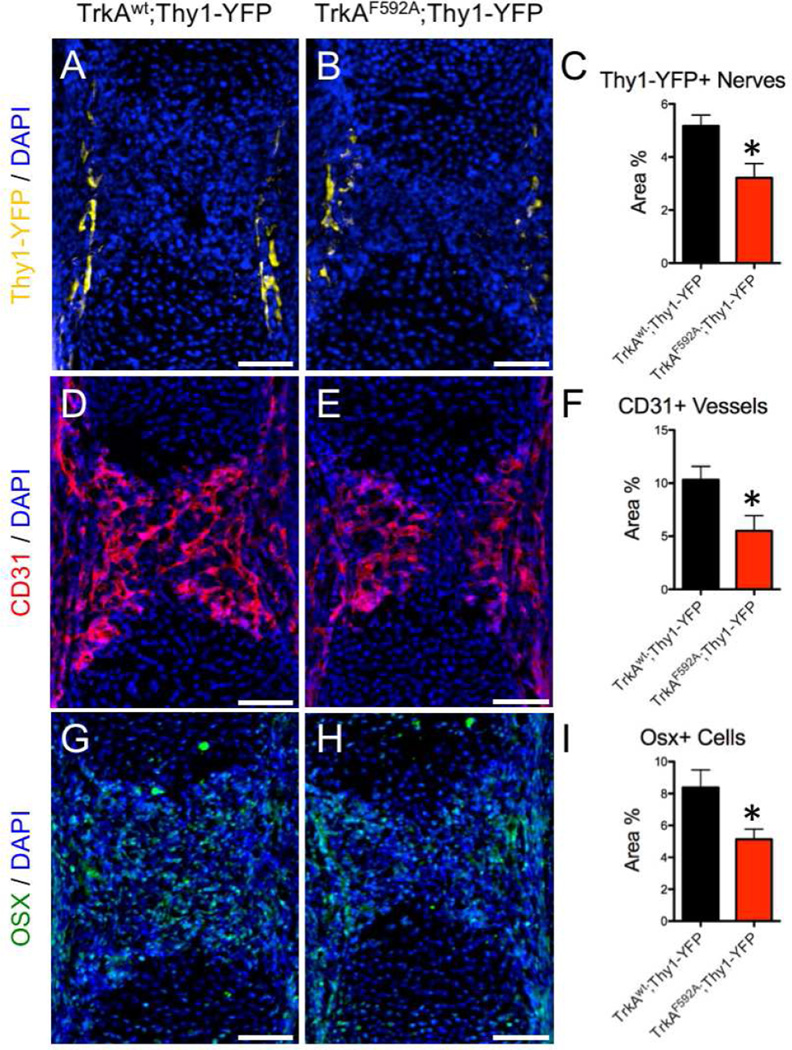
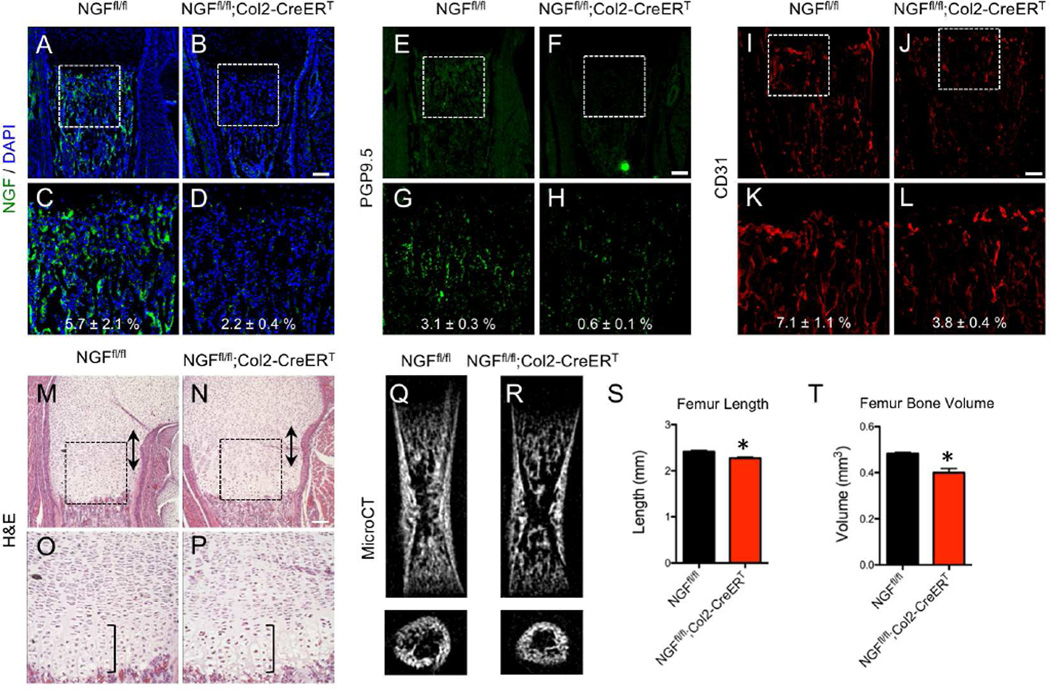
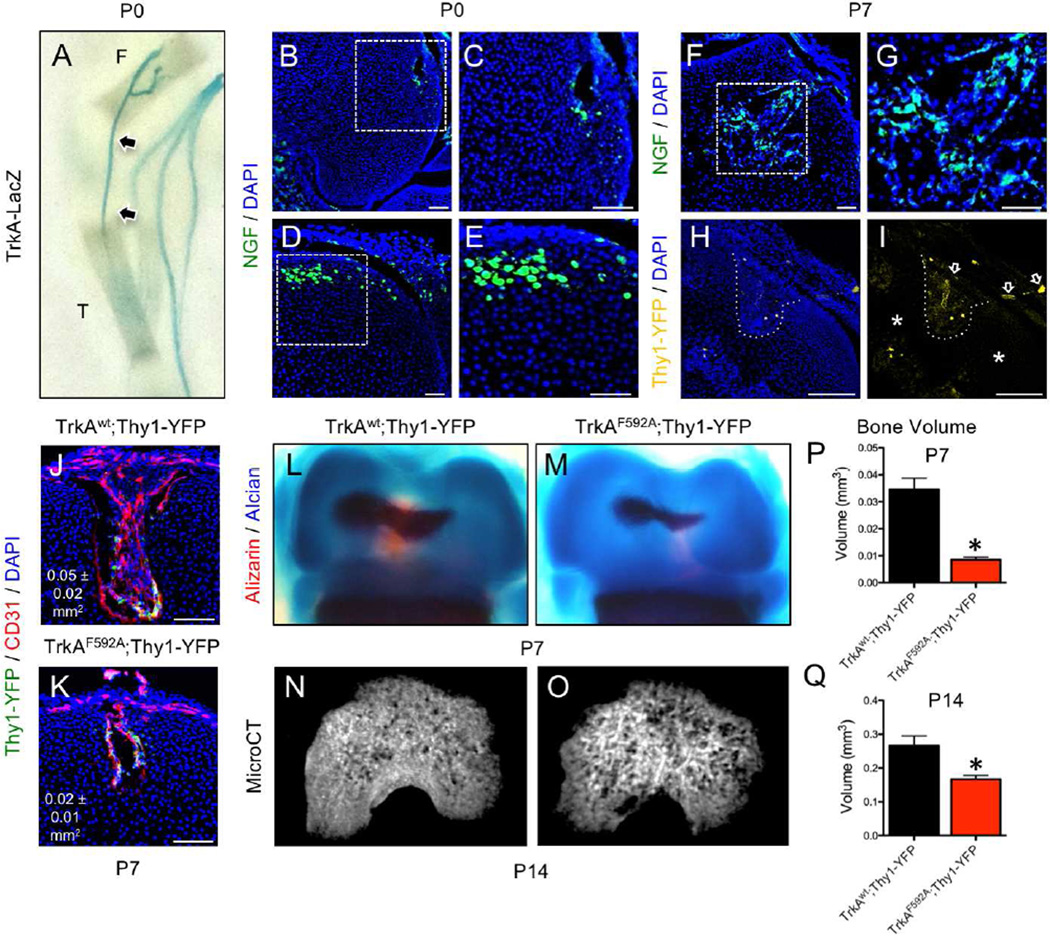
Developing tissues dictate the amount and type of innervation they require by secreting neurotrophins, which promote neuronal survival by activating distinct tyrosine kinase receptors. Here, we show that nerve growth factor (NGF) signaling through neurotrophic tyrosine kinase receptor type 1 (TrkA) directs innervation of the developing mouse femur to promote vascularization and osteoprogenitor lineage progression. At the start of primary ossification, TrkA-positive axons were observed at perichondrial bone surfaces, coincident with NGF expression in cells adjacent to centers of incipient ossification. Inactivation of TrkA signaling during embryogenesis in TrkA(F592A) mice impaired innervation, delayed vascular invasion of the primary and secondary ossification centers, decreased numbers of Osx-expressing osteoprogenitors, and decreased femoral length and volume. These same phenotypic abnormalities were observed in mice following tamoxifen-induced disruption of NGF in Col2-expressing perichondrial osteochondral progenitors. We conclude that NGF serves as a skeletal neurotrophin to promote sensory innervation of developing long bones, a process critical for normal primary and secondary ossification.

Keywords: endochondral bone; nerve growth factor; neurotrophic tyrosine kinase receptor type 1; sensory nerves.


Figures

Figure 1
Figure 1. Innervation of the developing mouse hindlimb by TrkA sensory nerves
TrkA-LacZ embryos were subjected to X-Gal staining, then imaged intact at A) E14.5 B) E16.5 C) E18.5 and D) P0. Hindlimbs were then removed and imaged separately to illustrate the medial aspect of the femur at E) E14.5 F) E16.5 G) E18.5 and H) P0. Femurs from Thy1-YFP embryos were carefully stripped of soft tissue, optically cleared, then imaged by confocal microscopy at I) E14.5 J) E16.5 K) E18.5 and L) P0.5, with high powered insets (M–P) that show the progressive arborization of nerves on the surface of the bone. Arrows indicate TrkA-LacZ+ nerve axon at the perichondrial region. Scale bars are 100 microns.
Figure 2
Figure 2. Localization of NGF expression in the developing mouse femur
A) Femurs harvested from NGF-eGFP mice at E14.5 illustrate the expression of NGF at the perichondrial surface, with B) high powered inset showing NGF-expressing perichondrial cells (arrows) at the primary ossification center. C) Immunohistochemistry against CD31 illustrated that the primary ossification center is not yet vascularized. D) Immunohistochemistry against Osx marked some chondrocytes in the primary ossification center as well as perichondrial cells closely associated with NGF expression (arrow). E) Femurs harvested from NGF-eGFP mice at P0 illustrate the continued expression of NGF throughout the developing bone, with F) high powered inset at the growth plate. G) Immunohistochemistry against CD31 showed high vascularization but no correlation with NGF expression. H) Immunohistochemistry against Osx indicates close association of some Osx-expressing cells with NGF expression (arrows). Scale bars are 100 microns. See also Figure S1, S2, and S3.
Figure 3
Figure 3. Inhibition of NGF-dependent TrkA signaling by 1NMPP1
A) A microfluidic device was used to culture DRG neurons plated in the blue compartment to project axons through microchannels (3 µm H × 10 µm W) into the red compartment for visualization. Neuron outgrowth was visualized in B) Positive Control (DMSO + NGF), C) Negative Control (DMSO alone), D) Low Dose (20 nM 1NMPP1 + NGF), and E) High Dose (200 nM 1NMPP1 + NGF) cultures. MSCs were transfected with F) control or G) NGF cDNA and plated in the red compartment using media with suboptimal NGF, with H) axon infiltration quantification. DRGs were sectioned and stained with antibodies against pTrk in I) TrkAwt;Thy1-YFP and J) TrkAF592A;Thy1-YFP adult mice 24 hours after 1NMPP1 administration. K) Western blot against pTrk with loading control on protein extracted from DRGs of adult TrkAF592A;Thy1-YFP mice injected with DMSO or 1NMPP1 with L) quantification. Whole mount fluorescence imaging of intact DRGs at postnatal day 7 from M) TrkAwt;Thy1-YFP and N) TrkAF592A;Thy1-YFP littermates treated with 1NMPP1 during gestation with L) quantification. Whole mount fluorescence imaging of skin at postnatal day 7 from P) TrkAwt;Thy1-YFP and Q) TrkAF592A;Thy1-YFP littermates treated with 1NMPP1 during gestation with R) quantification. * p < 0.05 by unpaired Student’s t-test.
Figure 4
Figure 4. Inhibition of TrkA signaling impairs postnatal innervation, vascularization, and bone acquisition
Nerves were visualized at the femoral metaphysis by Thy1-YFP expression in frozen sections from A) TrkAwt;Thy1-YFP and B) TrkAF592A;Thy1-YFP mice at postnatal day 7, with high powered insets (C,D). Blood vessels were visualized at the femoral metaphysis by immunohistochemistry against CD31 in frozen sections from E) TrkAwt;Thy1-YFP and F) TrkAF592A;Thy1-YFP mice at postnatal day 7, with high powered insets (G,H). H&E staining of I) TrkAwt;Thy1-YFP and J) TrkAF592A;Thy1-YFP mice at postnatal day 7 with hypertrophic zone (bracket) and proliferative zone (double arrow) marked, with high powered insets (K,L). Skeletal preparations of M) TrkAwt;Thy1-YFP and N) TrkAF592A;Thy1-YFP femurs at postnatal day 7. MicroCT analysis of TrkAwt;Thy1-YFP and TrkAF592A;Thy1-YFP mice at postnatal day 0 (O,P) and day 7 (Q,R) with quantification of S) bone volume and T) polar moment of inertia. * p < 0.05 by unpaired Student’s t-test. Scale bars are 100 microns. See also Figure S4, S5, and S7.
Figure 5
Figure 5. Inhibition of TrkA signaling impairs embryonic innervation, vascularization, and accumulation of osteoblast precursors
Frozen sections of the primary ossification center of the femur were analyzed for Thy1-YFP+ nerves in A) TrkAwt;Thy1-YFP and B) TrkAF592A;Thy1-YFP mice at embryonic day 15.5 with C) quantification. Similarly, blood vessels were visualized by immunohistochemistry against CD31 in D) TrkAwt;Thy1-YFP and E) TrkAF592A;Thy1-YFP mice at embryonic day 15.5 with F) quantification. Finally, osteoprogenitor cells were analyzed by immunohistochemistry against Osterix (Osx) in G) TrkAwt;Thy1-YFP and H) TrkAF592A;Thy1-YFP mice at embryonic day 15.5 with I) quantification. * p < 0.05 by Student’s t-test. Scale bars are 100 microns.
Figure 6
Figure 6. Disruption of NGF in osteochondral progenitors produces a skeletal phenotype similar to TrkAF592A mice
Tamoxifen was administered to pregnant mothers at E11.5, and NGFfl/fl and NGFfl/fl;Col2-CreERT offspring were harvested for analysis at postnatal day 0. Expression of NGF was visualized at the femoral metaphysis by immunohistochemistry against NGF on frozen sections from A) NGFfl/fl and B) NGFfl/fl;Col2-CreERT mice, with high powered insets (C,D). Nerves were visualized at the femoral metaphysis by immunohistochemistry against PGP9.5 on frozen sections from E) NGFfl/fl and F) NGFfl/fl;Col2-CreERT mice, with high powered insets (G,H). Blood vessels were visualized at the femoral metaphysis by immunohistochemistry against CD31 on frozen sections from I) NGFfl/fl and J) NGFfl/fl;Col2-CreERT, with high powered insets (K,L). H&E staining of paraffin sections of femurs from M) NGFfl/fl and N) NGFfl/fl;Col2-CreERT mice with hypertrophic zone (bracket) and proliferative zone (double arrow) marked, with high powered insets (O,P). MicroCT analysis of Q) NGFfl/fl and R) NGFfl/fl;Col2-CreERT with quantification of S) femur length and T) femur bone volume. * p < 0.05 by unpaired Student’s t-test. Scale bars are 100 microns. See also Figure S6 and S7.
Figure 7
Figure 7. Inhibition of TrkA signaling impairs secondary ossification
A) Whole mount images of TrkA-LacZ mice subjected to X-Gal staining at postnatal day 0 illustrate TrkA sensory nerve axons terminating at primary ossification centers and accessible to secondary ossification centers (arrows), with T (tibia) and F (femur) labeled. B) NGF expressing cells were observed at the leading front of nascent vascular canals in femurs from NGF-eGFP mice at postnatal day 0, with C) high powered inset. D) NGF expressing cells were also found at positions of putative canal formation in femurs from NGF-eGFP mice at postnatal day 0, with E) high powered inset. F) By postnatal day 7, the marrow of the secondary ossification centers had abundant NGF expressing cells, with G) high powered inset. H) In TrkAwt;Thy1-YFP mice analyzed at postnatal day 7, Thy1-YFP+ nerves were found within the vascular canal (dotted line). I) These Thy1-YFP+ nerves had infiltrated the canal from the perichondrial region (arrows), whereas nerves were not observed in non-vascularized regions of the epiphysis (asterisks). 1NMPP1 (40 uM) was administered to pregnant heterozygous TrkAF592A/wt mice and pups were sacrificed at postnatal days 7 and 14. J) At postnatal day 7, TrkAwt;Thy1-YFP mice had larger and more vascularized secondary ossification canals at the distal femur than K) TrkAF592A;Thy1-YFP mice. L) TrkAwt;Thy1-YFP mice had a significantly larger secondary ossification center in the distal femur than M) TrkAF592A;Thy1-YFP by skeletal preparation at postnatal day 7. N) Similarly, microCT reconstruction revealed that TrkAwt;Thy1-YFP mice had significantly increased bone volume than O) TrkAF592A;Thy1-YFP at postnatal day 14. Quantification of bone volume by microCT was performed at both P) P7 and Q) P14. * p < 0.05 by Student’s t-test. Scale bars are 100 microns.

References

    1. Behar O, Golden JA, Mashimo H, Schoen FJ, Fishman MC. Semaphorin III is needed for normal patterning and growth of nerves, bones and heart. Nature. 1996;383:525–528. - PubMed
    1. Bjurholm A, Kreicbergs A, Brodin E, Schultzberg M. Substance P- and CGRP-immunoreactive nerves in bone. Peptides. 1988;9:165–171. - PubMed
    1. Bonkowsky JL, Johnson J, Carey JC, Smith AG, Swoboda KJ. An infant with primary tooth loss and palmar hyperkeratosis: a novel mutation in the NTRK1 gene causing congenital insensitivity to pain with anhidrosis. Pediatrics. 2003;112:e237–e241. - PubMed
    1. Bouxsein ML, Boyd SK, Christiansen BA, Guldberg RE, Jepsen KJ, Muller R. Guidelines for assessment of bone microstructure in rodents using micro-computed tomography. J Bone Miner Res. 2010;25:1468–1486. - PubMed
    1. Brownell I, Guevara E, Bai CB, Loomis CA, Joyner AL. Nerve-derived sonic hedgehog defines a niche for hair follicle stem cells capable of becoming epidermal stem cells. Cell stem cell. 2011;8:552–565. - PMC - PubMed