. 2016 Sep 6;16(10):2651-2665.
doi: 10.1016/j.celrep.2016.07.083. Epub 2016 Aug 25.

Dynamics of Nucleosome Positioning Maturation following Genomic Replication

Affiliations

Dynamics of Nucleosome Positioning Maturation following Genomic Replication

Pauline Vasseur et al. Cell Rep. .

Abstract

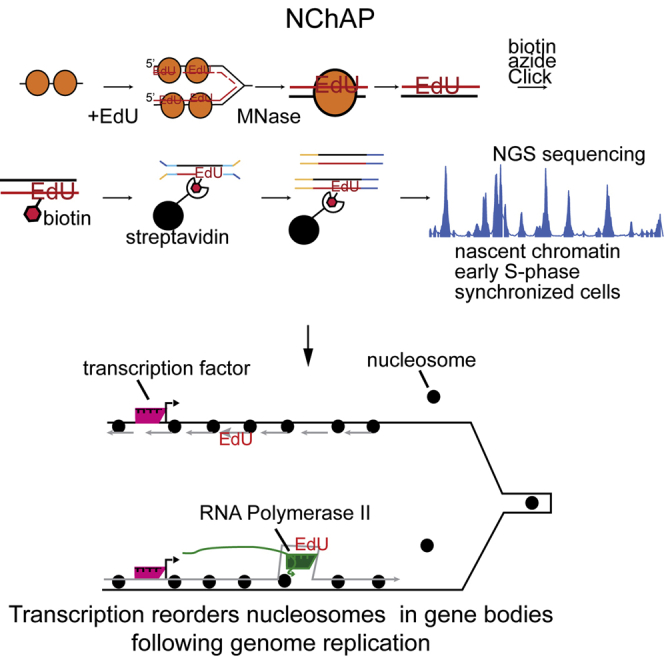
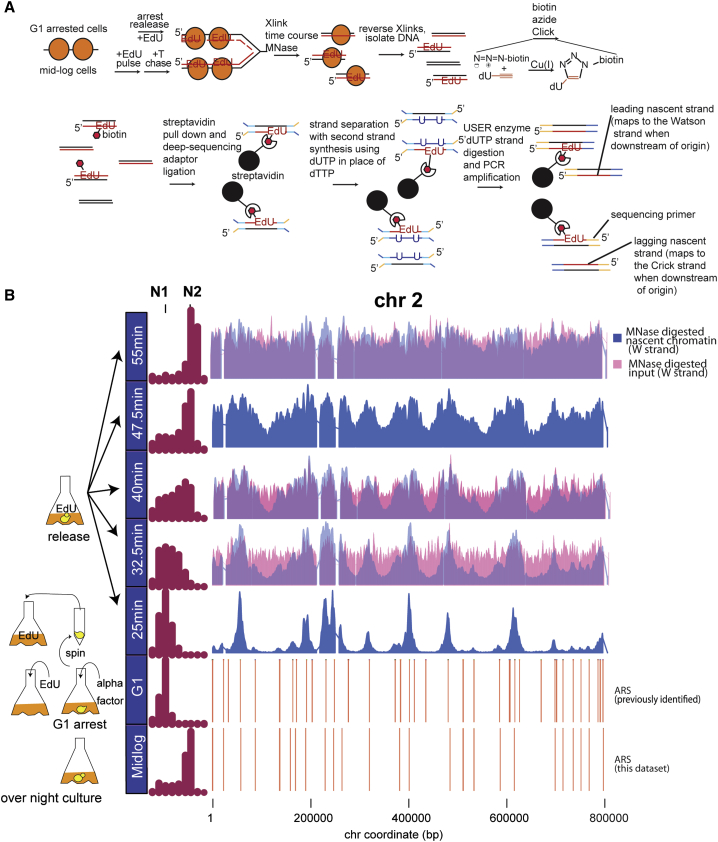
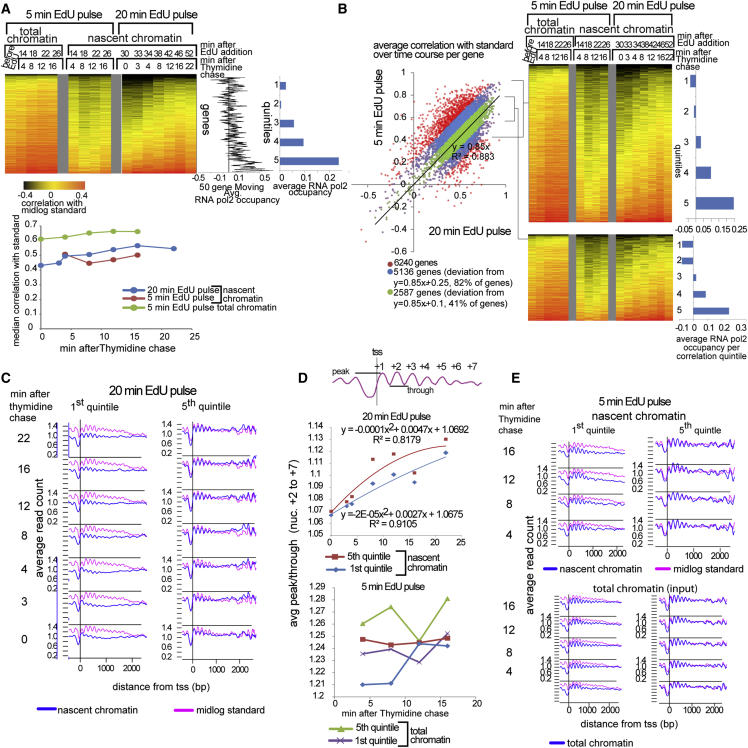
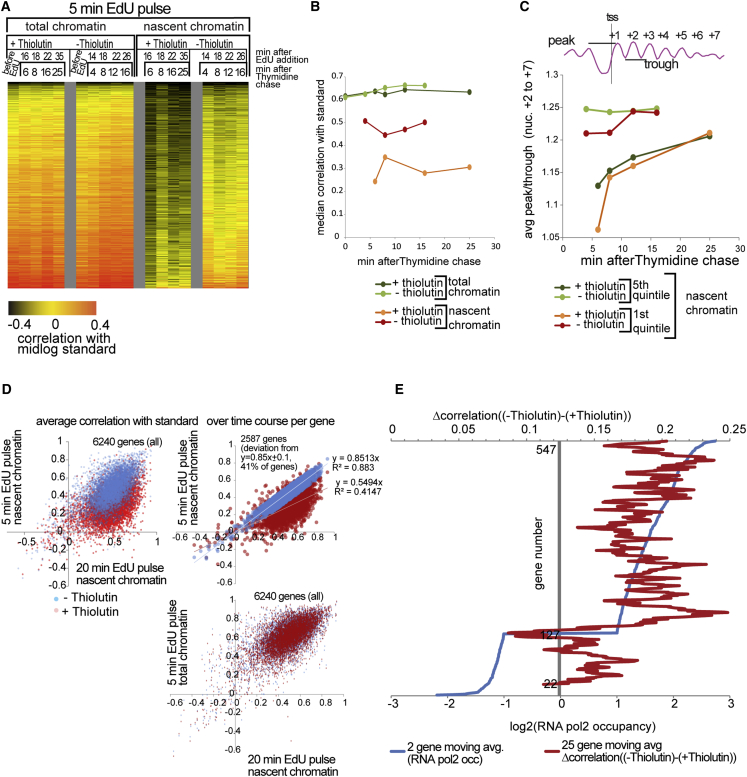
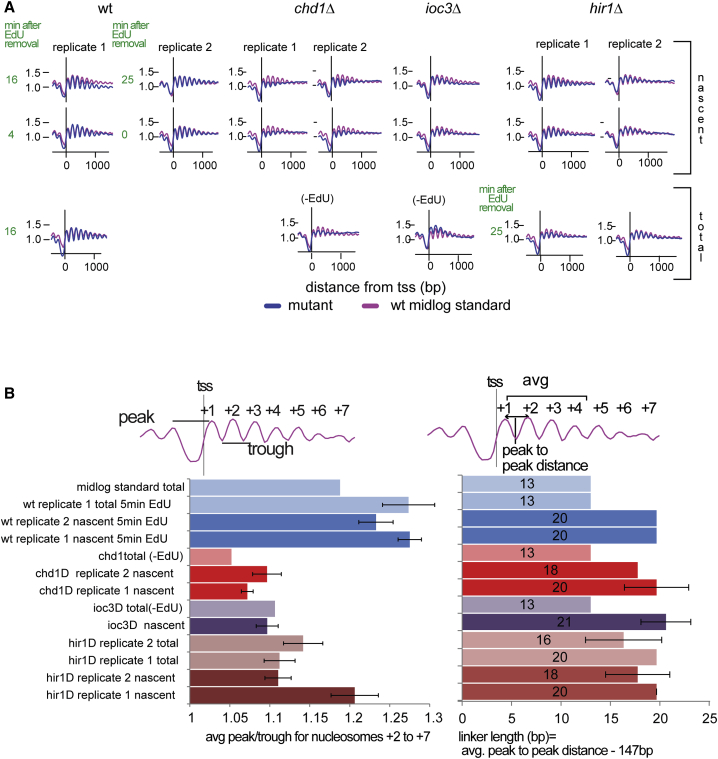
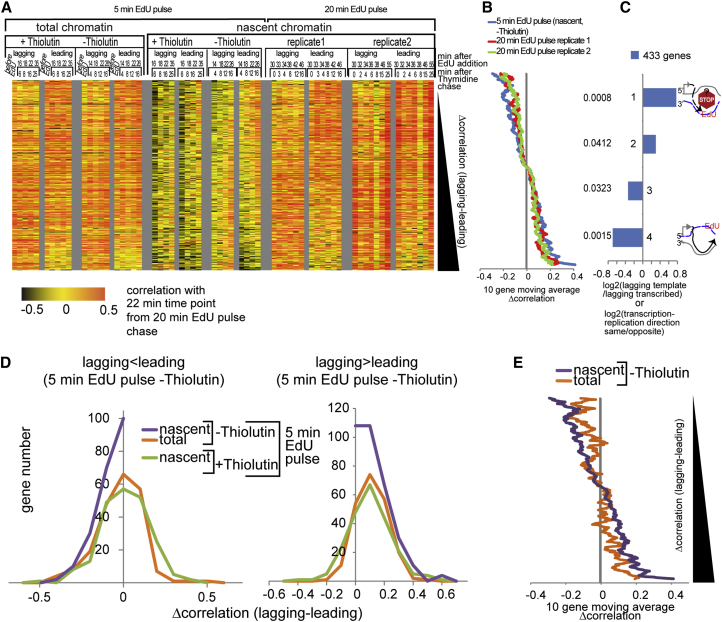
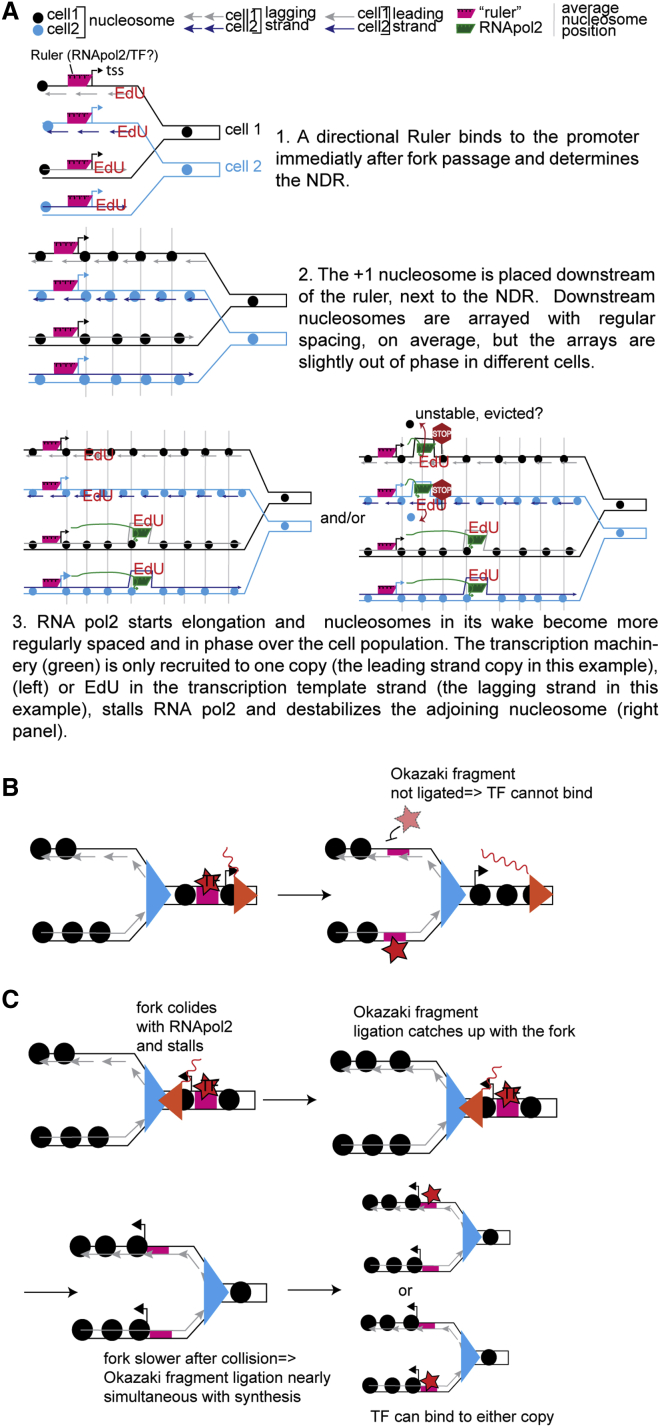
Chromatin is thought to carry epigenetic information from one generation to the next, although it is unclear how such information survives the disruptions of nucleosomal architecture occurring during genomic replication. Here, we measure a key aspect of chromatin structure dynamics during replication-how rapidly nucleosome positions are established on the newly replicated daughter genomes. By isolating newly synthesized DNA marked with 5-ethynyl-2'-deoxyuridine (EdU), we characterize nucleosome positions on both daughter genomes of S. cerevisiae during chromatin maturation. We find that nucleosomes rapidly adopt their mid-log positions at highly transcribed genes, which is consistent with a role for transcription in positioning nucleosomes in vivo. Additionally, experiments in hir1Δ mutants reveal a role for HIR in nucleosome spacing. We also characterized nucleosome positions on the leading and lagging strands, uncovering differences in chromatin maturation dynamics at hundreds of genes. Our data define the maturation dynamics of newly replicated chromatin and support a role for transcription in sculpting the chromatin template.


Figures

None
Graphical abstract
Figure 1
Figure 1
Nascent Chromatin Avidin Pull-Down (A) Diagram of nascent chromatin avidin pull-down (NChAP). For synchronized cells, after arrest in G1, cells are released into fresh media in the presence of EdU and aliquots are fixed at regular time intervals. In asynchronous populations, cells are pulsed with EdU, followed by a thymidine (T) chase. Chromatin is digested with MNase, and the isolated DNA fragments are subject to a click reaction that adds biotin to the incorporated EdU. Biotinylated DNA is purified with streptavidin-conjugated magnetic beads, and NGS libraries are constructed on DNA fragments attached to the beads. cDNA strands are separated with primer extension in the presence of dUTP. The dUTP-containing strand is then digested with USER enzymes prior to PCR. This ensures that only nascent strands are sequenced. (B) Density distribution of DNA content measured by flow cytometry before arrest (mid-log) in G1 and at indicated times after release from G1 arrest (left panel). Nascent chromatin Watson (W) strand read distribution on chromosome 2 at indicated times after release (blue bars) and total chromatin input are shown (total MNase-digested chromatin isolated prior to the click reaction; 32.5-, 40-, and 55-min time points, pink bars). Replication origins (ARS) are shown in the two bottom rows: ARS from this study (first) and previously documented ARS (second) are shown. Read counts were grouped in 400-bp bins and first normalized to the genome average read count and then to the highest peak value in each chromosome.
Figure 2
Figure 2
Transcription Influences Nucleosome Positioning Maturation Rates (A) Heatmap of Pearson correlations between nucleosome profiles from nascent chromatin (5- and 20-min EdU pulse) or total chromatin input (5-min EdU pulse) and total chromatin from log phase cells (mid-log standard) for every yeast gene (rows) at indicated time points after the thymidine chase (columns). 0.5 was subtracted from the actual correlation to obtain higher contrast. Correlation values were corrected for variability in total sequencing read numbers between time points (Supplemental Experimental Procedures).Correlation profiles were sorted by maturation index (increasing average correlation over the time course) in the 20-min EdU pulse. Mid-log RNA Pol2 occupancy is shown as a 50-gene moving window average (middle graph) and as an average for each correlation quintile (right bar graph). Only Watson strand reads analysis is shown (Crick reads analysis is comparable). The plot below the heatmap shows the evolution of median correlations for each time point over time, indicating that nascent chromatin from both datasets (5- and 20-min EdU pulse) mature at similar rates whereas total chromatin does not change. (B) Scatterplot of maturation indices for the 20-min EdU versus the 5-min EdU pulse datasets. All genes (6,226): red. Genes within a deviation of 0.25 or 0.1 from the regression line (y = 0.85x): green (82% of all genes) and blue (41% of all genes), respectively. Gene maturation indices from these two datasets are overall correlated. Variance from the regression line for individual genes likely reflects experimental technical variability, to which the Pearson correlation metric is sensitive. As shown in the corresponding correlation heatmaps on the right, the correlation between maturation indices and RNA Pol2 occupancy is preserved in robustly correlated genes from the two time courses. (C) Average nucleosome profiles from the 20-min EdU pulse dataset at indicated time points after thymidine incubation: nascent chromatin (blue); mid-log standard (pink), for the slow- and fast-maturing first and fifth quintiles (1,245 genes each), respectively (as defined in A). (D) The change in the average peak/trough ratio (diagram on top) for nucleosomes +2 to +7 in the average nascent and total chromatin profiles of the two quintiles from (C) (top) and (E) (bottom). (E) As in (C), but for the 5-min EdU pulse dataset. Nascent and total input chromatin fractions are shown in the top and bottom panels, respectively. The seemingly faster stabilization of the average peak/trough ratio compared to the 20-min EdU pulse experiment is likely due to heterogeneous EdU incorporation rates in the population. In the 5-min EdU pulse experiment, we are detecting a subpopulation of cells that incorporates EdU very rapidly after addition (Figure S5), and consequently, our time course somewhat counterintuitively detects chromatin maturation events that are taking place later after EdU incorporation than in the 20-min EdU pulse experiment, in which most cells have incorporated EdU much later after addition.
Figure 3
Figure 3
Transcription Inhibition Impairs Chromatin Maturation (A) Heatmap of Pearson correlations between nucleosome profiles of the mid-log standard (as in Figure 2) and nascent chromatin or total chromatin input (5-min EdU pulse) from thiolutin-treated and untreated cells (lines) at indicated time points after EdU addition (columns). 0.5 was subtracted from actual correlations for higher contrast. Correlation profiles were sorted by increasing maturation index from the 20-min EdU pulse experiment as in Figure 2. Only Watson reads are shown. (B) Evolution of median correlations over time. Maturation indices are on average 35% lower in thiolutin-treated cells. (C) Change in average peak/trough ratios for nucleosomes +2 to +7 in the fifth and first quintiles from Figure 2. (D) Scatterplot of maturation indices for the 20-min EdU versus the 5-min EdU pulse in thiolutin-treated (red) or untreated (blue) cells. Plots are shown for all genes from nascent chromatin (top left), robustly measured genes from nascent chromatin (top right), and total chromatin input (bottom right). The difference between maturation indices of −thiolutin and +thiolutin cells is at least +0.1 in 73% of genes (top left) or 70% of genes (top right) represented on the plots. There is no difference in maturation indices in total chromatin between thiolutin-treated and untreated cells, suggesting that transcription-governed chromatin maturation is specific for newly replicated chromatin (bottom right). (E) Maturation indices of highly transcribed genes are more affected by thiolutin. The plot shows the 25-gene moving window average of the difference between maturation indices in non-treated and thiolutin-treated cells (red; Δcorrelation((−thiolutin) − (+thiolutin))) for 551 genes ordered by log2 (RNA pol2 occupancy; blue). Only genes with log2(RNA pol2) ≤ −1 (poorly transcribed genes) or log2(RNApol2) ≥ 1 (highly transcribed genes) were used in the analysis.
Figure 4
Figure 4
Nucleosome Positioning Maturation in Chromatin Remodeler Mutants (A) Average TSS-aligned nucleosome profiles for all yeast genes in WT and mutant backgrounds (blue lines) from nascent (top row) and total chromatin (bottom). Profiles for the earliest and latest time point after the 5-min EdU pulse and 5-min thymidine chase (marked in green) are shown for nascent profiles. The last time point from the corresponding total chromatin input fraction is shown for replicate 1 of WT and replicates 1 and 2 of hir1Δ cells. The total chromatin profiles for chd1Δ and ioc3Δ are from asynchronous log phase cultures without EdU. The WT mid-log standard profile (pink) is the same as in Figure 2. The WT replicate 1 profiles are from the 5-min EdU pulse dataset from Figures 2 and 3. WT replicate 2 is a repeat of the 5-min EdU pulse experiment. (B) Average peak/trough ratios (for nucleosomes +2 to +7; left) and average linker length (values in the center of the bar; between nucleosomes +1 and +2, +2 and +3, and +3 and +4; right). The error bars represent the SD between time points in the EdU pulse-chase experiment: hir1Δ replicate 1 nascent (0, 2, 4, 6, 15, and 25 min); hir1Δ replicate 2 nascent (0, 2, 4, 6, 8, 15, and 25 min); hir1Δ replicate 1 total (0, 8, 15, and 25 min); hir1Δ replicate 2 total (2, 6, 8, and 25 min); ioc3Δ nascent (0, 2, 4, 6, 8, 15, and 25 min); chd1Δ replicates 1 and 2 nascent (0, 2, 4, 6, 8, 15, and 25 min); WT replicate 1 nascent and total (4, 8, 12, and 16 min); and WT replicate 2 nascent (0, 2, 4, 6, 8, 15, and 25 min).
Figure 5
Figure 5
Nucleosome Positioning Maturation Is Impaired if the Nascent Strand Is the Transcription Template Strand (A) Heatmap of Pearson correlations between nascent or total chromatin profiles and the 22-min time point of the 20-min EdU pulse experiment (Figure 2) for the lagging and leading strand copies of 433 genes replicated from efficient origins. Genes (lines) and time points (columns) are shown. 0.5 was subtracted from the correlations as in Figures 2 and 3. Correlation profiles were sorted by the increasing average difference between the nascent chromatin maturation indices (Δcorrelation) of the lagging and the leading copies from three experiments—one 5-min EdU and two 20-min EdU pulse experiments. 433 genes out of the 1,064 genes replicated from efficient origins have consistent Δcorrelations in all three experiments. In other words, the lagging copy has a bigger or smaller maturation index than the leading copy, respectively, in all experiments. Note that lagging and leading copy profiles are composed of a mixture of Watson and Crick strand profiles, depending on the relative position of the gene with respect to its closest efficient origin. (B) Ten-genes moving window average of Δcorrelations from the 20-min and the 5-min EdU pulse experiments ordered as in (A). (C) log2 of enrichment (compared to the whole gene set in the heatmap) for genes in which the lagging nascent strand is also the transcription template for each Δcorrelation quartile. p values from the hypergeometric distribution test are shown on the left. Quartiles 1 and 4 are significantly enriched for genes in which the nascent strand is the transcription template or is transcribed, respectively. (D) Distribution of Δcorrelations from (A) (lagging index − leading index) from different datasets for quartiles 1 and 2 (left; 216 genes) and 3 and 4 (right; 217 genes) of the 433 gene set defined in (A). The difference in nascent chromatin maturation between the lagging and the leading gene copies is reduced upon thiolutin addition, i.e., the Δcorrelation distribution is shifted to the right or left in the left or right panels, respectively. This is consistent with the hypothesis that transcription elongation is higher on the copy with the higher maturation index, and when transcription is inhibited with thiolutin, the differences in chromatin maturation indices on the two copies are eliminated. (E) Ten-genes moving window average of Δcorrelations from the 5-min EdU pulse experiment without thiolutin, total chromatin input (orange), and nascent chromatin (purple), ordered as in (A) and (B).
Figure 6
Figure 6
Effect of EdU on Steady-State mRNA Levels (A) Heatmap of a gene expression two-channel microarray. Each line represents average log2 ratios (two probes per gene) of mRNA from mid (32 min) and late (40 min) S phase versus genomic DNA isolated from G1-arrested cells from two biological replicates with two dye flip technical replicates each. All yeast genes are grouped by cell-cycle expression and ordered by replication timing. Note that, as expected for S phase cells, G1 and mitotic genes are turning off and on, respectively, in late S phase, whereas S and M/G1 genes are on and off, respectively. Cell-cycle expression annotations were taken from the SGD database. Cell-cycle-independent genes were also ordered by the normalized average (from four microarrays shown on the left) difference in mRNA enrichment between late (40 min) and mid (32 min) S phase time points from cells not treated with EdU (right panel). The average differences were normalized by subtracting the mean difference for all cell-cycle-independent genes from the difference for each gene. (B) Fifty (top left) and ten (bottom right) genes moving window averages of the average difference in mRNA levels between mid and late S phase in EdU-treated (green) or non-treated (red) cells, all cell-cycle-independent genes (top); genes with an average RNA level difference between late and mid S phase of 0.5 and higher (non-buffered genes) in non-treated cells (343 genes; bottom). Genes are ordered by replication timing (black line). (C) Distribution of average log2 (RNA/DNA) late S (40 min) − log2 (RNA/DNA) mid S (32 min) of all 5,072 cell-cycle-independent genes (left) and of genes from Figure 5 that showed differences in chromatin maturation between the leading and the lagging gene copies (right). All genes from each set are shown in light blue and yellow for EdU-treated and non-treated cells, respectively, and genes with log2 (RNA/DNA) late S (40 min) − log2 (RNA/DNA) mid S (32 min) ≥ 0.5 (non-buffered genes) are shown in dark blue and orange for EdU-treated and non-treated cells, respectively. EdU interference with transcription can only be detected in genes that “escape” buffering and are probably transcribed from both copies like the ∼343 genes from (C). (D) GO annotations analysis for 343 non-buffered genes (FuncAssociate 2.1b).
Figure 7
Figure 7
Models of Chromatin Maturation and Asymmetric TF Distribution (A) Model for a timeline of nucleosome positioning maturation in the wake of the replication fork. Replication forks from two different cells are shown: cell 1 (black) and cell 2 (blue). (B and C) Models for asymmetric distribution of TFs. (B) It is less likely that RNA pol2 ahead of the fork (red triangle) and the replication fork (blue triangle) will collide when replication and transcription travel in the same direction. As the fork travels unhindered, Okazaki fragment ligation lags behind the fork, and TFs (star) bound to the promoter (magenta rectangle) ahead of the fork are more likely to rebind to the leading copy after replication of the promoter sequence. (C) A head-on collision of the fork and RNA pol2 traveling toward each other may cause fork stalling or slowing down, and Okazaki fragment ligation can happen almost simultaneously with synthesis, which allows TFs to bind to either the leading or lagging copy of the promoter.

Comment in

  • Nucleosomes Find Their Place in Life.
    Tyler JK. Tyler JK. Trends Genet. 2016 Nov;32(11):689-690. doi: 10.1016/j.tig.2016.09.001. Epub 2016 Sep 17. Trends Genet. 2016. PMID: 27650123 Free PMC article.

Similar articles

Cited by

References

    1. Alabert C., Groth A. Chromatin replication and epigenome maintenance. Nat. Rev. Mol. Cell Biol. 2012;13:153–167. - PubMed
    1. Alabert C., Bukowski-Wills J.C., Lee S.B., Kustatscher G., Nakamura K., de Lima Alves F., Menard P., Mejlvang J., Rappsilber J., Groth A. Nascent chromatin capture proteomics determines chromatin dynamics during DNA replication and identifies unknown fork components. Nat. Cell Biol. 2014;16:281–293. - PMC - PubMed
    1. Alabert C., Barth T.K., Reverón-Gómez N., Sidoli S., Schmidt A., Jensen O.N., Imhof A., Groth A. Two distinct modes for propagation of histone PTMs across the cell cycle. Genes Dev. 2015;29:585–590. - PMC - PubMed
    1. Bintu L., Kopaczynska M., Hodges C., Lubkowska L., Kashlev M., Bustamante C. The elongation rate of RNA polymerase determines the fate of transcribed nucleosomes. Nat. Struct. Mol. Biol. 2011;18:1394–1399. - PMC - PubMed
    1. Borodina T., Adjaye J., Sultan M. A strand-specific library preparation protocol for RNA sequencing. Methods Enzymol. 2011;500:79–98. - PubMed

MeSH terms