

Mental simulation of routes during navigation involves adaptive temporal compression
- PMID: 27568586
- PMCID: PMC5143185
- DOI: 10.1016/j.cognition.2016.08.009
Mental simulation of routes during navigation involves adaptive temporal compression
Abstract
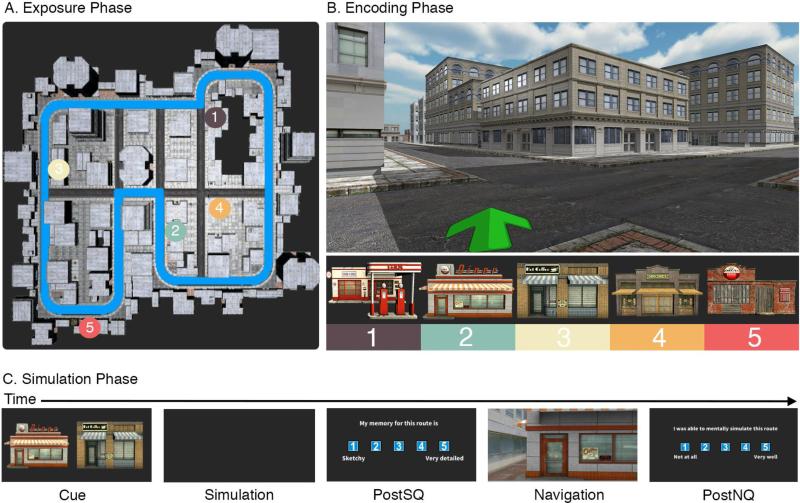
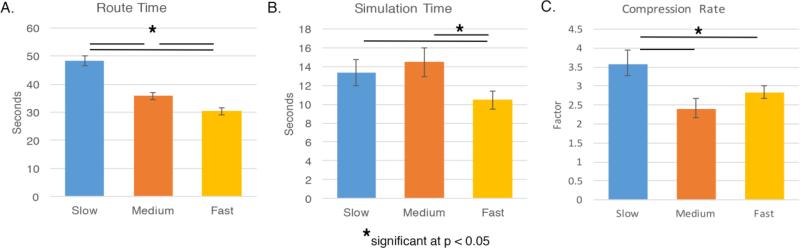
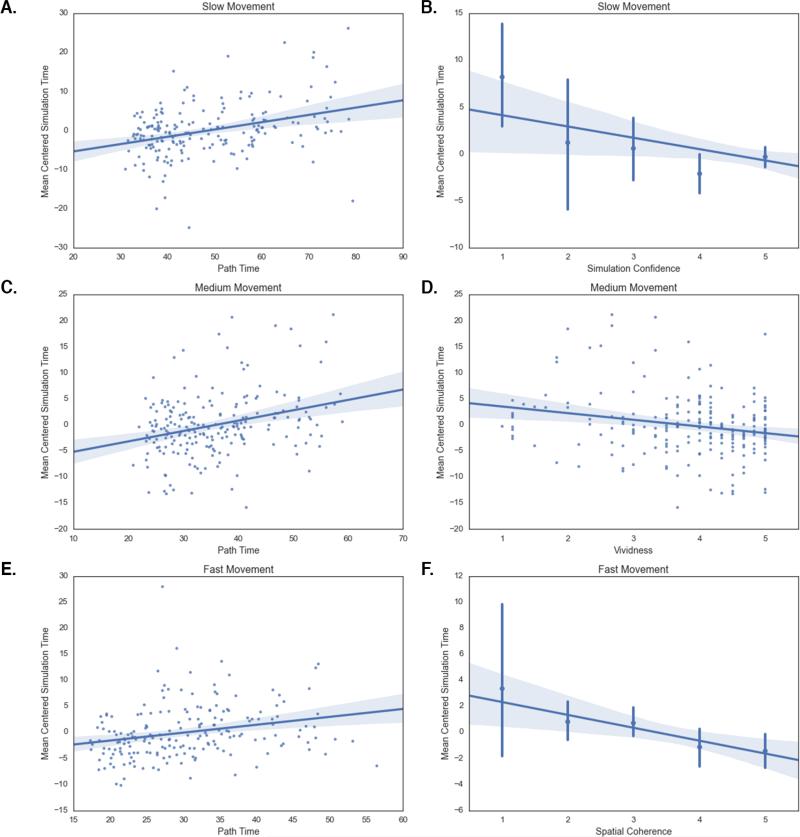
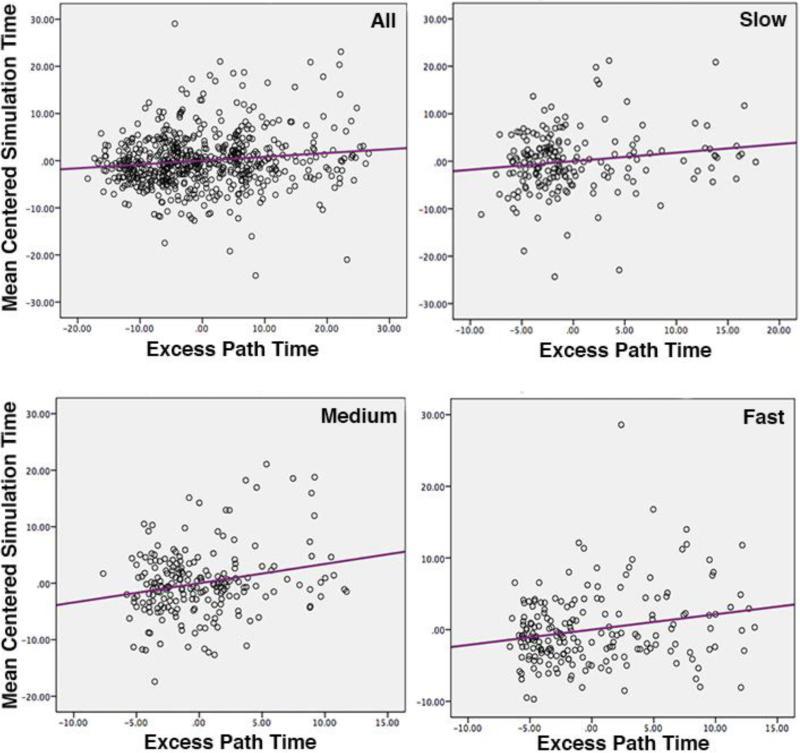
Mental simulation is a hallmark feature of human cognition, allowing features from memories to be flexibly used during prospection. While past studies demonstrate the preservation of real-world features such as size and distance during mental simulation, their temporal dynamics remains unknown. Here, we compare mental simulations to navigation of routes in a large-scale spatial environment to test the hypothesis that such simulations are temporally compressed in an adaptive manner. Our results show that simulations occurred at 2.39× the speed it took to navigate a route, increasing in compression (3.57×) for slower movement speeds. Participant self-reports of vividness and spatial coherence of simulations also correlated strongly with simulation duration, providing an important link between subjective experiences of simulated events and how spatial representations are combined during prospection. These findings suggest that simulation of spatial events involve adaptive temporal mechanisms, mediated partly by the fidelity of memories used to generate the simulation.
Keywords: Episodic memory; Hippocampus; Imagination; Prospection; Recollection; Virtual reality.
Copyright © 2016 Elsevier B.V. All rights reserved.
Figures
References
-
- Addis DR, Sacchetti DC, Ally BA, Budson AE, Schacter DL. Episodic simulation of future events is impaired in mild Alzheimer's disease. Neuropsychologia. 2009;47(12):2660–2671. http://doi.org/10.1016/j.neuropsychologia.2009.05.018. - DOI - PMC - PubMed
-
- Addis DR, Wong AT, Schacter DL. Age-related changes in the episodic simulation of future events. Psychological Science. 2008;19(1):33–41. http://doi.org/10.1111/j.1467-9280.2008.02043.x. - DOI - PubMed
-
- Bonasia K, Blommesteyn J, Moscovitch M. Memory and navigation: Compression of space varies with route length and turns. Hippocampus. 2015 http://doi.org/10.1002/hipo.22539. - DOI - PubMed
-
- Borst G, Kosslyn SM. Individual differences in spatial mental imagery. Quarterly Journal of Experimental Psychology. 2010;2006;63(10):2031–2050. http://doi.org/10.1080/17470211003802459. - DOI - PubMed
-
- Botzung A, Denkova E, Manning L. Experiencing past and future personal events: functional neuroimaging evidence on the neural bases of mental time travel. Brain and Cognition. 2008;66(2):202–212. http://doi.org/10.1016/j.bandc.2007.07.011. - DOI - PubMed
Publication types
MeSH terms
Grants and funding
LinkOut - more resources
Full Text Sources
Other Literature Sources
Miscellaneous
