. 2016 Dec 15;76(24):7219-7230.
doi: 10.1158/0008-5472.CAN-15-2860. Epub 2016 Aug 28.

FOXD1-ALDH1A3 Signaling Is a Determinant for the Self-Renewal and Tumorigenicity of Mesenchymal Glioma Stem Cells

Affiliations

FOXD1-ALDH1A3 Signaling Is a Determinant for the Self-Renewal and Tumorigenicity of Mesenchymal Glioma Stem Cells

Peng Cheng et al. Cancer Res. .

Abstract

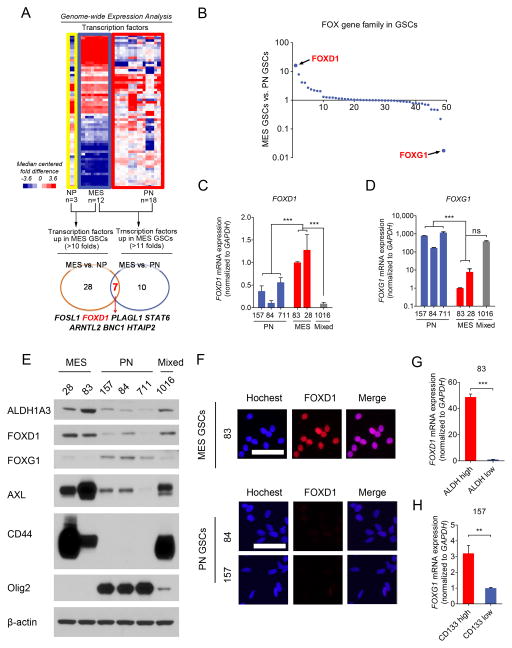
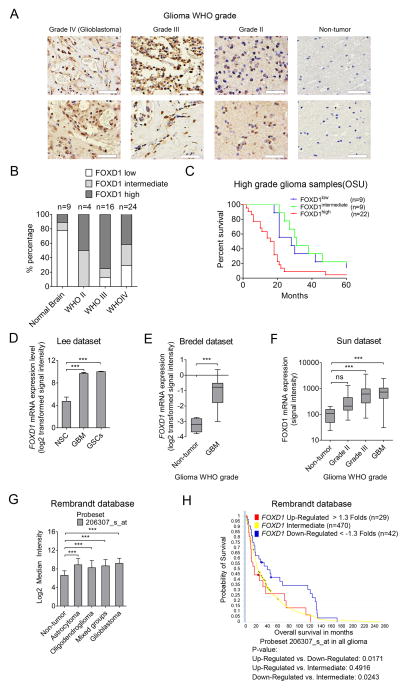
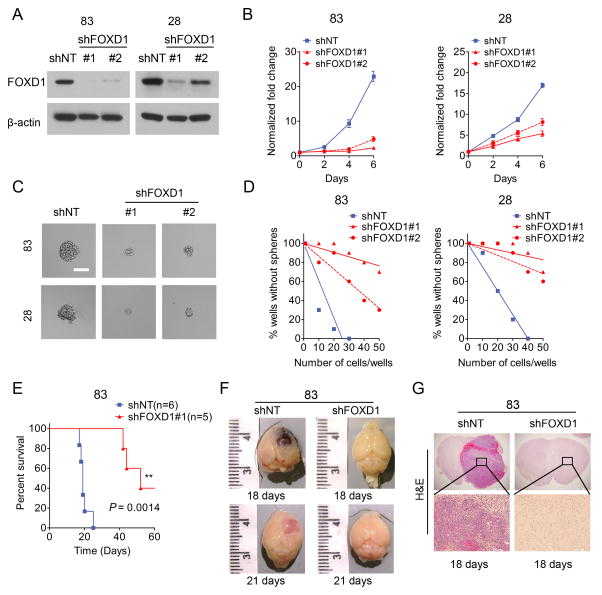
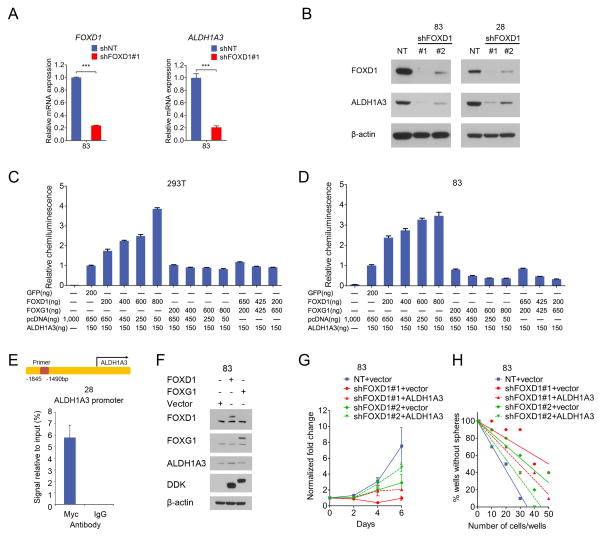
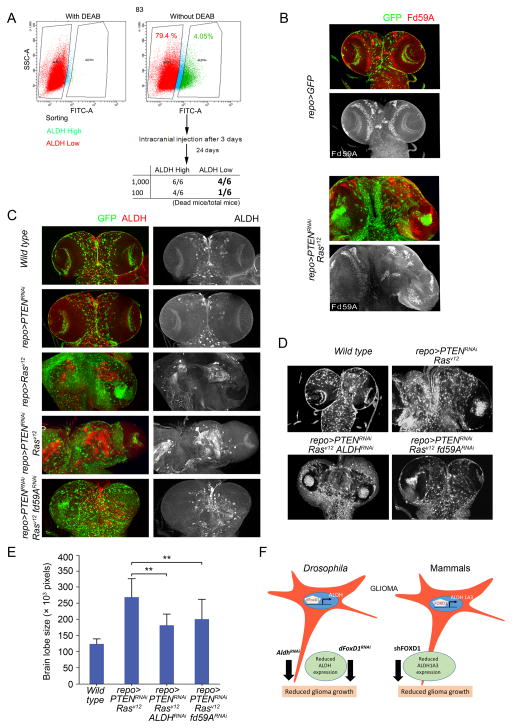
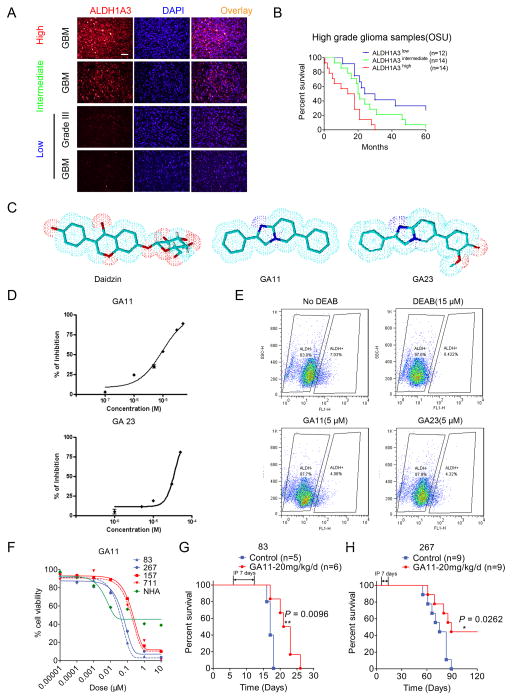
Glioma stem-like cells (GSC) with tumor-initiating activity orchestrate the cellular hierarchy in glioblastoma and engender therapeutic resistance. Recent work has divided GSC into two subtypes with a mesenchymal (MES) GSC population as the more malignant subtype. In this study, we identify the FOXD1-ALDH1A3 signaling axis as a determinant of the MES GSC phenotype. The transcription factor FOXD1 is expressed predominantly in patient-derived cultures enriched with MES, but not with the proneural GSC subtype. shRNA-mediated attenuation of FOXD1 in MES GSC ablates their clonogenicity in vitro and in vivo Mechanistically, FOXD1 regulates the transcriptional activity of ALDH1A3, an established functional marker for MES GSC. Indeed, the functional roles of FOXD1 and ALDH1A3 are likely evolutionally conserved, insofar as RNAi-mediated attenuation of their orthologous genes in Drosophila blocks formation of brain tumors engineered in that species. In clinical specimens of high-grade glioma, the levels of expression of both FOXD1 and ALDH1A3 are inversely correlated with patient prognosis. Finally, a novel small-molecule inhibitor of ALDH we developed, termed GA11, displays potent in vivo efficacy when administered systemically in a murine GSC-derived xenograft model of glioblastoma. Collectively, our findings define a FOXD1-ALDH1A3 pathway in controling the clonogenic and tumorigenic potential of MES GSC in glioblastoma tumors. Cancer Res; 76(24); 7219-30. ©2016 AACR.


Conflict of interest statement

of Potential Conflicts of Interest No potential conflicts of interest were disclosed by the authors.

Figures

Figure 1
Figure 1. FOXD1 is a key MES GSC transcription factor
A. Genome-wide transcriptome microarray analysis (GSE67089) shows that FOXD1 is one of seven upregulated transcription factors in MES gliomaspheres when compared to Neural Progenitors (NPs) (>10 fold) and PN glioma spheres (>11 fold). B. mRNA expression levels of the Forkhead TF family members in the GSE67089 dataset reveal that FOXD1 and FOXG1 are the highest expressed genes in MES and PN glioma spheres, respectively. C, D. RT-qPCR analyses of FOXD1 (C) (MES vs. PN, P<0.001, n=3; MES vs. mixed, P<0.001, n=3, one way ANOVA) and FOXG1 (D) (MES vs. PN, P=0.0025, n=3; MES vs. mixed, P=0.2537, n=3, one way ANOVA) mRNA in the indicated glioma spheres. E. Western blot analyses of ALDH1A3, FOXD1, FOXG1, CD44, AXL and Olig2 expression in the indicated glioma spheres. β-actin serves as a loading control. F. Immunocytochemistry analyses of FOXD1 in MES83, PN84, and PN157 glioma spheres. Hoechst is used for nuclear staining. Bar, 50μm. G. RT-qPCR analyses of FOXD1 mRNA in ALDHhigh and ALDHlow cells derived from MES83 glioma spheres. (P<0.001, n=3, t-test) H. RT-qPCR analyses of FOXG1 mRNA in CD133high and CD133low cells derived from PN157 glioma spheres. (P=0.0017, n=3, t-test)
Figure 2
Figure 2. FOXD1 expression is clinically relevant in high-grade gliomas
A, B. Representative immunohistochemical images (A) and analyses (B) of FOXD1 in WHO grade IV (Glioblastoma), grade III glioma, grade II glioma, and non-tumor brain samples. Bar, 50 μm. (Non-tumor n=9, grade II n=4, grade III n=16, grade IV n=24). C. Kaplan-Meier analyses evaluating the correlation between FOXD1 protein expression and survival of 40 high grade glioma patients (FOXD1 high vs. low, P=0.0324; FOXD1 high vs. intermediate, P=0.0039; FOXD1 intermediate vs. low, P=0.2896, log rank test). D–F. Analyses of the indicated GEO datasets show a higher expression of FOXD1 in glioma than in Neural Stem Cell (NSC) samples and non-tumor tissues. D. Lee dataset (GSE4536; NSCs n=3, GBM n=22, GSCs n=20; P<0.001, one way ANOVA, probe set 206307_s_at). E. Bredel dataset (GSE2223; Non-tumor n=4, GBM n=29; P<0.0001, t test, probe set 1876). F. Sun dataset (GSE4290, Non-tumor n=23, grade II n=45, grade III n=31, GBM n=81; P< 0.0001, one-way ANOVA, probe set 206307_s_at). G. Analysis of the Rembrandt data shows a higher FOXD1 mRNA expression in astrocytoma (n=148), oligodendroglioma (n=67), mixed groups (n=11), and in GBM samples (n=228) than non-tumor samples (n=28) (probe set 206307_s_at). H. Analysis of the Rembrandt database indicates the inverse correlation between FOXD1 mRNA expression and post-surgical survival of glioma patients (P=0.0171, FOXD1 Up-Regulated > 1.3-Fold, n=29 vs. FOXD1 Down-Regulated < −1.3-Fold, n=42; P=0.0243, Down-Regulated < −1.3-Fold, n=42 vs. Intermediate n=470, probe set: 206307_s_at).
Figure 3
Figure 3. FOXD1 regulates MES GSC growth both in vitro and in vivo
A. Western blot analyses of MES83 and MES28 glioma spheres transduced with shRNA targeting FOXD1 (shFOXD1#1 or shFOXD1#2) or a non-targeting control (shNT). B. In vitro growth assay shows that shRNAs targeting FOXD1 (shFOXD1#1 and shFOXD1#2) inhibit cell proliferation of MES83 and MES28 glioma spheres (P<0.0001, n=6, one-way ANOVA). C. Representative images of MES83 and MES28 glioma spheres transduced with shRNA targeting FOXD1. shNT serves as a control. Bar, 60μm. D. In vitro clonogenicity assays (limiting dilution neurosphere formation assays) indicate that FOXD1 shRNA decreases clonogenicity of MES83 and MES28 cells (MES83 P<0.001, and MES28 P<0.001, ELDA analyses). E. Kaplan-Meier analysis of nude mice harboring intracranial tumors derived from MES83 GSCs transduced with shNT (n=6) or shFOXD1#1 (n=5). (P=0.0014, with log-rank test) F, G. Representative images of brains (F) and H&E stained brain sections (G) of mice after intracranial transplantation of MES83 glioma spheres transduced with shNT or shFOXD1#1. Bar, 1 mm (G, upper panel) and 100 μm (G, lower panel).
Figure 4
Figure 4. ALDH1A3 is a functional MES GSC marker and is transcriptionally regulated by FOXD1
A. RT-qPCR analyses of ALDH1A3 and FOXD1 mRNA in MES83 glioma spheres transduced with shFOXD1#1 or shNT (P<0.001, n=3, with t-test). B. Western blot analyses of ALDH1A3 in MES83 and MES28 glioma spheres transduced with shFOXD1#1, shFOXD1#2 or shNT. β-actin serves as a loading control. C, D. Luciferase assays with 293T cells (C) and MES83 glioma spheres (D) co-transfected with an ALDH1A3 promoter reporter plasmid together with overexpression vectors for the indicated genes (n=3). E. ChIP-qPCR assay using Myc antibody or control IgG in MES28 glioma spheres transfected with a FOXD1 (Myc-DDK-tagged) plasmid shows the binding of FOXD1 on the ALDH1A3 promoter (P<0.001, n=3, t-test). F. Western blot analyses of the indicated proteins in MES83 glioma spheres transduced with the overexpression plasmids encoding FOXD1, FOXG1, or empty vector. G, H. ALDH1A3 overexpression partially restores the in vitro proliferation (G, P<0.001, one way ANOVA) and neurosphere formation capacities (H, P<0.001, ELDA analysis) which are inhibited by shFOXD1#1 or #2 in MES83 glioma spheres.
Figure 5
Figure 5. RNA interference-mediated silencing of FD59A and ALDH attenuates growth of Drosophila glial neoplasia
A. Upper panel, ALDEFLUOR assay in MES83 glioma spheres with or without ALDH1 inhibitor DEAB. Lower panel, frequencies of tumor formation of ALDH1high and ALDH1low cell populations of MES83 glioma spheres in mice. B. Expression of Fd59A (Drosophila ortholog of FOXD1) (red, grey) in the Drosophila CNS derived from larvae of repoGAL4 UASGFP and repoGAL4 UASGFP UASPTENRNAi UASRasv12. Glial cells are marked by GFP (green). C. Expression levels of ALDH (red, grey) in the larval CNS of repoGAL4 UASGFP (Wild type), repoGAL4 UASGFP UASPTENRNAi, repoGAL4 UASGFP UASRasv12, repoGAL4 UASGFP UASPTENRNAi UASRasv12 and repoGAL4 UASGFP UASPTENRNAi UASRasv12 fd59ARNAi. D. The effects of ALDHRNAi and fd59ARNAi on the growth of glial neoplasms of repoGAL4 UASPTENRNAi UASRasv12 larvae. Both RepoGAL4 UASGFP (Wild-type) and repoGAL4 UASPTENRNAi UASRasv12 samples are included for comparison. E. The quantification of brain tumor volume (brain lobe size in pixels) from the indicated larvae (repoGAL4 UASPTENRNAi UASRasv12 ALDHRNAi vs. repoGAL4 UASPTENRNAi UASRasv12, P=0.008, n=3, one way ANOVA; repoGAL4 UASPTENRNAi UASRasv12 fd59ARNAi vs. repoGAL4 UASPTENRNAi UASRasv12, P=0.007, n=3, one way ANOVA). F. The schematic diagram depicts that ALDH and fd59A (dFOXD1) are evolutionarily conserved genes contributing tumorigenesis of glial neoplasms.
Figure 6
Figure 6. The novel ALDH small molecule inhibitor GA11 attenuates MES GSC growth both in vitro and in vivo
A. Representative immunofluroescence images of ALDH1A3 in 40 high grade glioma samples. DAPI is used for nuclear labeling. Bar, 50 μm. B. Kaplan-Meier analysis of ALDH1A3 expression indicates the negative correlation between ALDH1A3 protein expression and survival in high grade glioma patients. (ALDH1A3 high vs. ALDH1A3 intermediate, P=0.0285, ALDH1A3 high vs. ALDH1A3 low, P=0.0016, and ALDH1A3 intermediate vs. ALDH1A3 low, P=0.1769, with log rank test). C. The comparison of the essential core structure of the naturally occurring ALDH inhibitor, daidzin, and the structures of synthesized novel imidazo [1,2-a] pyrimidine ALDH inhibitors, GA11 and GA23. D. Log-dose response analysis of GA11 (upper panel) and GA23 (lower panel) in yeast. E. Flow cytometry analyses using ALDEFLUOR indicate that both GA11 and GA23 (5μM, 30 min) inhibit ALDH activity in MES83 glioma spheres. F. Log-dose response analyses of the effects of GA11 on the viabilities of MES83, MES267, PN157, PN711, glioma spheres and NHA cells. G, H. Treatment with GA11 (intraperitoneal injection, 20mg/kg for 7 days from day seven) prolongs survival periods of mice bearing MES83-derived intracranial tumors (G) (P=0.0096, with log rank test) and those of mice with MES267-derived intracranial tumors (H) (P=0.0262, with log rank test).

Similar articles

Cited by

References

    1. Wen PY, Kesari S. Malignant gliomas in adults. The New England journal of medicine. 2008;359:492–507. - PubMed
    1. Stupp R, Mason WP, van den Bent MJ, Weller M, Fisher B, Taphoorn MJ, et al. Radiotherapy plus concomitant and adjuvant temozolomide for glioblastoma. The New England journal of medicine. 2005;352:987–96. - PubMed
    1. Venere M, Fine HA, Dirks PB, Rich JN. Cancer stem cells in gliomas: identifying and understanding the apex cell in cancer’s hierarchy. Glia. 2011;59:1148–54. - PMC - PubMed
    1. Bhat KP, Balasubramaniyan V, Vaillant B, Ezhilarasan R, Hummelink K, Hollingsworth F, et al. Mesenchymal differentiation mediated by NF-kappaB promotes radiation resistance in glioblastoma. Cancer cell. 2013;24:331–46. - PMC - PubMed
    1. Waghmare I, Roebke A, Minata M, Kango-Singh M, Nakano I. Intercellular cooperation and competition in brain cancers: lessons from Drosophila and human studies. Stem cells translational medicine. 2014;3:1262–8. - PMC - PubMed

MeSH terms

Substances