. 2016 Oct 15;76(20):5970-5982.
doi: 10.1158/0008-5472.CAN-16-0091. Epub 2016 Aug 28.

Immune-Stimulatory Effects of Rapamycin Are Mediated by Stimulation of Antitumor γδ T Cells

Affiliations

Immune-Stimulatory Effects of Rapamycin Are Mediated by Stimulation of Antitumor γδ T Cells

Vinh Dao et al. Cancer Res. .

Abstract

The FDA-approved mTOR inhibitor rapamycin mediates important immune effects, but its contributions to the anticancer effects of the drug are unclear. Here we report evidence that rapamycin-mediated cancer protection relies upon stimulation of γδ T cells. In a well-established mouse model of carcinogen and inflammation-driven skin carcinogenesis, IFNγ recruited γδ TCRmid T cells to the epidermis where rapamycin boosted their perforin-dependent antitumor properties. These antitumor cells were mostly Vγ5-Vγ4-Vγ1- in phenotype. IFNγ signals were required in both hematopoietic and nonhematopoietic cells for rapamycin to optimally promote epidermal infiltration of γδ TCRmid T cells, as mediated by CXCR3-CXCL10 interactions, along with the antitumor effects of these cells. In mouse xenograft models of human squamous cell carcinoma, rapamycin improved human γδ T-cell-mediated cancer cell killing. Our results identify immune mechanisms for the cancer prevention and treatment properties of rapamycin, challenging the paradigm that mTOR inhibition acts primarily by direct action on tumor cells. Cancer Res; 76(20); 5970-82. ©2016 AACR.


Figures

Figure 1
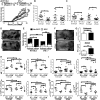
Figure 1. eRapa requires IFN-γ to prevent DMBA/TPA-induced skin cancer
WT and IFN-γ−/− mice on Eudragit control or eRapa given DMBA/TPA as described. A, Tumor multiplicity over time (average papilloma number/mouse). p-value, 2-way ANOVA. B, Tumor burden (∑tumor area/mouse). p-value, Mann-Whitney U test. C, Area/tumor (total tumor burden/number of tumors/mouse). p-value, Mann-Whitney U test. D, Representative mice with papillomas (arrows). E, Number of mice with squamous cell carcinoma (% SCC indicated). p-value, Fisher's exact test. F, Representative mice with SCC (arrow). G, IFN-γ levels in epidermis (top) and serum (bottom), N=8/group. p-value, unpaired t test. H-K, Digested epidermis from WT and IFN-γ−/− mice on Eudragit control or eRapa given DMBA/TPA assayed for frequency (left) and numbers (right) of CD45+CD3+αβ TCR+ T cells, CD45+CD3NK1.1+ natural killer cells, CD45+CD3+γδ TCRhi T cells, and CD45+CD3+γδ TCRmid T cells, N=5/group. TCR, T cell receptor. p-values, one-way ANOVA with Neuman-Keuls post-test. ns, not significant. *p<0.05, **p<0.01, ***p<0.001. Error bars, means ± s.e.m.
Figure 2
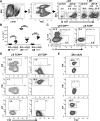
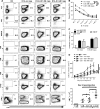
Figure 2. γδ TCRmid T cells are increased in DMBA/TPA skin carcinogenesis without eRapa
A, Representative flow cytometry gating for epidermal γδ T cells without (−D/T) or with (+D/T) DMBA/TPA as described. Within CD3+ gate, CD3lo, CD3mid, CD3hi correspond to αβ TCR+, γδ TCRmid, and γδ TCRhi cells, respectively. FSC, forward scatter. SSC, side scatter. On the far right, the legends above the plots define the population studied. The CD45int and CD45lo cells are dead based on viability dye staining. B, Epidermal T cell frequency of CD45+CD3+γδ TCRmid, CD45+CD3+γδ TCRhi, and CD45+CD3+γδ TCR (αβ TCR+) populations from (A), N=5-10/group. p-value, unpaired t test. ***p<0.001. Error bars, means ± s.e.m. C, Digested epidermis from WT mice given DMBA/TPA. Representative flow cytometry of N=5 intracellular IL-17A and IL-22 in CD45+CD3+γδ TCRmid and CD45+CD3+γδ TCRhi epidermal T cells. D, Digested epidermis from WT mice given DMBA/TPA. Representative flow cytometry of N=5, Vγ chain composition in CD45+CD3+γδ TCRmid and CD45+CD3+γδ TCRhi epidermal T cells. E, Vγ chain composition in skin draining lymph node (dLN) γδ TCR+ T cells from WT mice given DMBA/TPA.
Figure 3
Figure 3. eRapa requires γδ T cells to prevent DMBA/TPA-induced skin cancer
DMBA/TPA-challenged δ TCR−/− mice (lacking γδ T cells) on Eudragit control or eRapa as described. A, Tumor multiplicity. p-value, 2-way ANOVA. B, Total tumor burden. p-value, unpaired t test. C, Area/tumor/mouse. p-value, unpaired t test. D, Representative mice with papillomas (arrows). E, Number of mice with squamous cell carcinoma (SCC). p-value, Fisher's exact test. F, Representative mice with SCC (arrows). ns, not significant. Fischer's exact test. Error bars, means ± s.e.m.
Figure 4
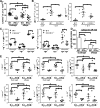
Figure 4. IFN-γ promotes epidermal γδ T cell migration, activation, and cytotoxicity
A, Digested epidermis from DMBA/TPA-challenged WT and IFN-γ−/− mice on Eudragit control or eRapa. CXCR3+γδ TCRmid epidermal T cell frequency, N=14-15/group. B, Frequency (left) and absolute numbers (right) of CD45+CD3+γδ TCRmid epidermal T cells in WT and CXCR3−/− mice without (−D/T) or with (+D/T) short-course DMBA/TPA (6 TPA applications) as described, N=5/group. C, Vγ chain composition frequency (left) and absolute numbers (right) of CD45+CD3+γδ TCRmid epidermal T cells from mice in (B) given DMBA/TPA. D, Epidermal CXCL10, N=8/group, from DMBA/TPA-challenged WT and IFN-γ−/− mice on Eudragit control or eRapa. E, Frequency of indicated markers on epidermal γδ TCRmid T cells, N=5/group, from DMBA/TPA-challenged WT and IFN-γ−/− mice on Eudragit control or eRapa. p-values, one-way ANOVA with Neuman-Keuls post-test of square root transformed data. ns, not significant. *p<0.05, **p<0.01, ***p<0.001. Error bars, means ± s.e.m.
Figure 5
Figure 5. IFN-γ signals in hematopoietic and non-hematopoietic cells are required for optimal eRapa-mediated skin cancer protection
DMBA/TPA-challenged bone marrow chimeras on eRapa as described. A, Tumor multiplicity. p-value, 2-way ANOVA. B, Total tumor burden. p-value, one-way ANOVA with pairwise Tukey honest significant difference comparisons. C, Number of bone marrow chimera mice with squamous cell carcinoma (SCC). p-value, Fisher's exact test. D, Representative mice from (C). P, papilloma. E, Epidermal γδ TCRmid T cell frequency, N=5/group, from DMBA/TPA-challenged bone marrow chimera on eRapa. p-value, one-way ANOVA. F, Epidermal CXCL10, N=5/group. p-values, one-way ANOVA with Neuman-Keuls post-test. ns, not significant. *p<0.05, **p<0.01, ***p<0.001. Error bars, means ± s.e.m.
Figure 6
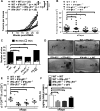
Figure 6. eRapa promotes γδ T cell-mediated regression of DMBA/TPA tumors
A, γδ T cells isolated from skin dLN of WT or Prf1−/− mice on 2 weeks of Eudragit control or eRapa, then injected (inj) into tumors of δ TCR−/− mice on Eudragit control or eRapa. Some tumors were non-injected (non-inj). B and E, Tumor areas assessed at baseline and 2 weeks post γδ T cell injections. p-value, paired t test. C and F, % initial tumor area at 2 weeks post injections. D and G, Representative δ TCR−/− mice. Arrows, injected tumors. Prf1, perforin. H, Apoptosis in tumors from (B-D). I, Injection of WT epidermal γδ TCRmid or γδ TCRhi T cells into tumors of δ TCR−/− mice on Eudragit control or eRapa. p-values, one-way ANOVA with pairwise Tukey honest significant difference comparisons. ns, not significant. *p<0.05, **p<0.01. Error bars, means ± s.e.m.
Figure 7
Figure 7. Rapamycin increases human γδ T cell activation and anti-tumor cytotoxicity in vitro and in vivo
Human γδ T cells cultured in vitro with isopentenyl pyrophosphate, recombinant human IL-2 ± 0.01 nM or 0.5 nM rapamycin for 14 days. A, Phenotype of human γδ T cells assessed by flow cytometry in a representative culture of six different donors. B, In vitro γδ T cell-mediated cytotoxicity against SCC4 squamous cell carcinoma cells. p-value, 2-way ANOVA. C, Inhibition of cytotoxicity with 10 μg/ml anti-human γδ TCR, anti-NKG2D, or both. % cytotoxicity inhibition at 25:1 effector:target (E:T) ratio. D, Top, cultured γδ T cells co-injected with SCC4 cells in 1:3 ratio S.C. in NSG mice with no further in vivo rapamycin, N=7/group. p-value, 2-way ANOVA. Bottom, absolute numbers of γδ T cells recovered from tumors at day 24 post-injection. ns, not significant. *p<0.05, **p<0.01, ***p<0.001. Error bars, means ± s.e.m.

Similar articles

Cited by

References

    1. Chiarini F, Evangelisti C, McCubrey JA, Martelli AM. Current treatment strategies for inhibiting mTOR in cancer. Trends Pharmacol Sci. 2015;36(2):124–35. - PubMed
    1. Harrison DE, Strong R, Sharp ZD, Nelson JF, Astle CM, Flurkey K, et al. Rapamycin fed late in life extends lifespan in genetically heterogeneous mice. Nature. 2009;460(7253):392–5. - PMC - PubMed
    1. Hasty P, Livi CB, Dodds SG, Jones D, Strong R, Javors M, et al. eRapa Restores a Normal Life Span in a FAP Mouse Model. Cancer Prev Res (Phila) 2014;7(1):169–78. - PMC - PubMed
    1. Livi CB, Hardman RL, Christy BA, Dodds SG, Jones D, Williams C, et al. Rapamycin extends life span of Rb1+/− mice by inhibiting neuroendocrine tumors. Aging (Albany NY) 2013;5(2):100–10. - PMC - PubMed
    1. Miller RA, Harrison DE, Astle CM, Baur JA, Boyd AR, de Cabo R, et al. Rapamycin, But Not Resveratrol or Simvastatin, Extends Life Span of Genetically Heterogeneous Mice. J Gerontol A Biol Sci Med Sci. 2011;66(2):191–201. - PMC - PubMed

MeSH terms