

The antiandrogen flutamide is a novel aryl hydrocarbon receptor ligand that disrupts bile acid homeostasis in mice through induction of Abcc4
- PMID: 27569425
- PMCID: PMC5061623
- DOI: 10.1016/j.bcp.2016.08.021
The antiandrogen flutamide is a novel aryl hydrocarbon receptor ligand that disrupts bile acid homeostasis in mice through induction of Abcc4
Abstract
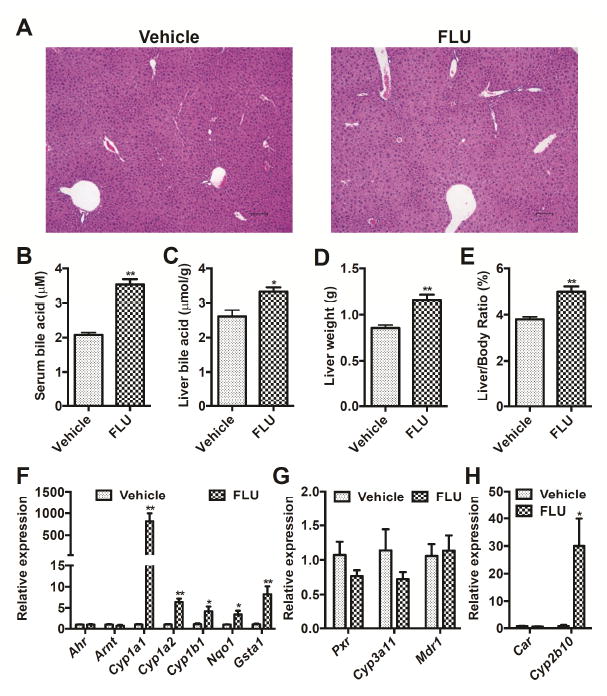
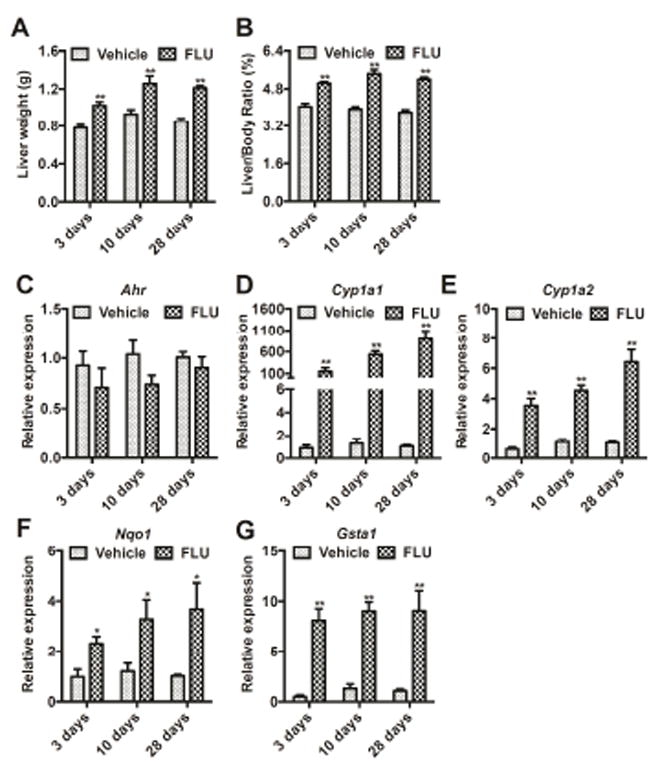
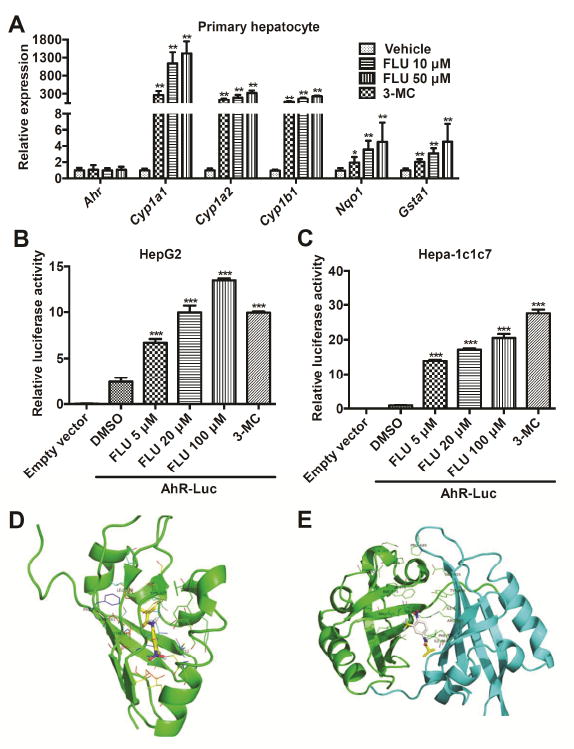
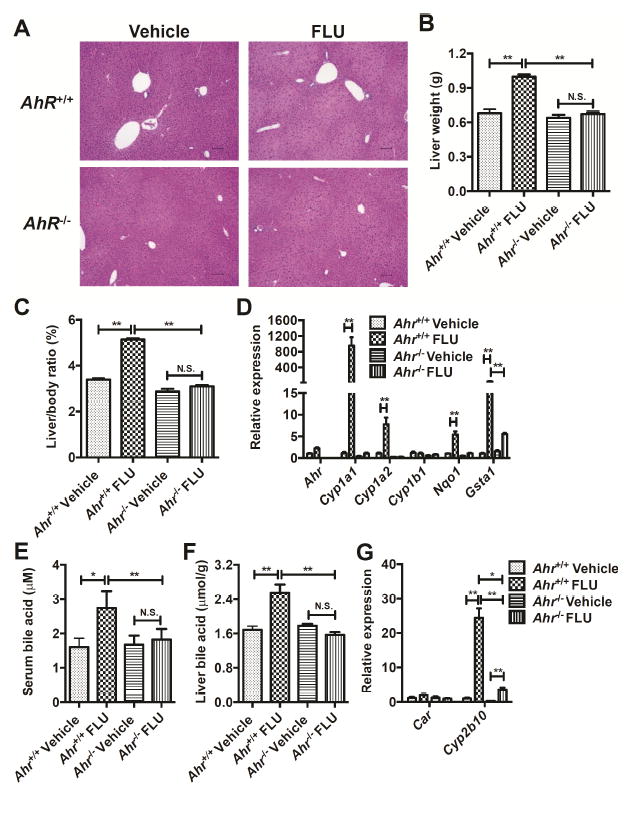
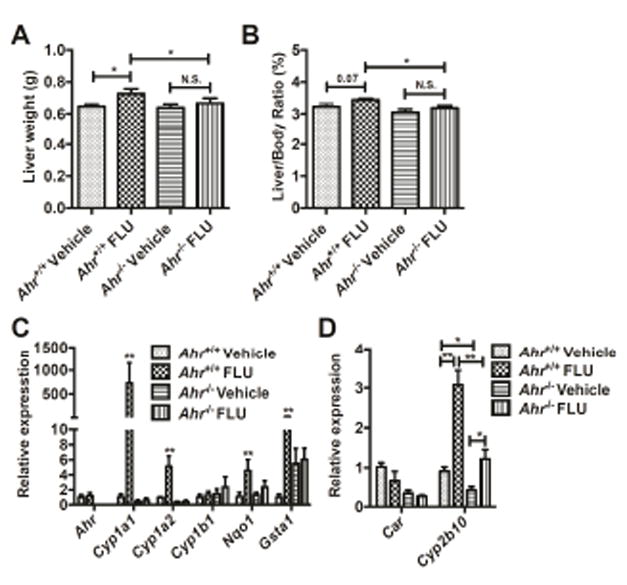
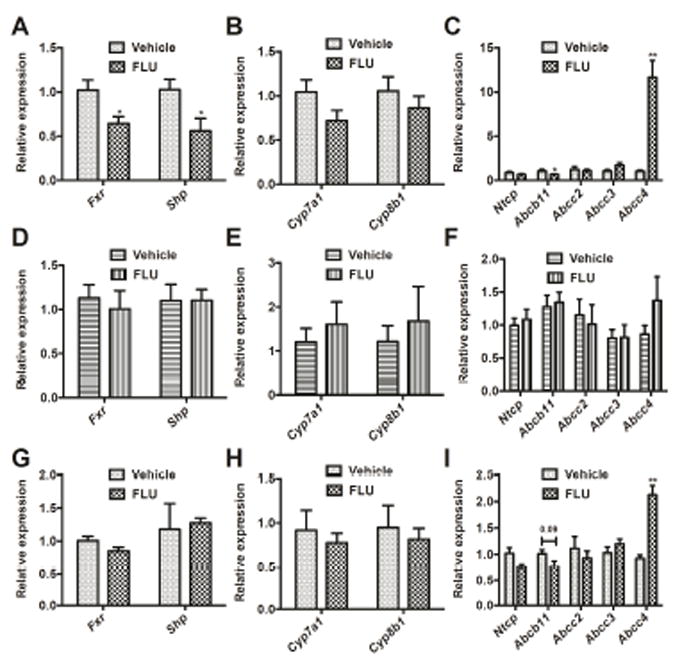
Flutamide (FLU), an oral, nonsteroidal antiandrogen drug used in the treatment of prostate cancer, is associated with idiosyncratic hepatotoxicity that sometimes causes severe liver damage, including cholestasis, jaundice, and liver necrosis. To understand the mechanism of toxicity, a combination of aryl hydrocarbon receptor (Ahr)-deficient (Ahr-/-) mice, primary hepatocytes, luciferase reporter gene assays, in silico ligand docking and ultra-performance chromatography-quadrupole time-of-flight mass spectrometry-based metabolomics was used. A significant increase of liver weights, and liver and serum bile acid levels was observed after FLU treatment, indicating hepatomegaly and disrupted bile acid homeostasis. Expression of the AhR gene battery was markedly increased in livers of wild-type mice Ahr+/+ treated with FLU, while no change was noted in Ahr-/- mice. Messenger RNAs encoded by AhR target genes were induced in primary mouse hepatocytes cultured with FLU, which confirmed the in vivo results. Ligand-docking analysis further predicted that FLU is an AhR agonist ligand which was confirmed by luciferase reporter gene assays. Multivariate data analysis showed that bile acids were responsible for the separation of vehicle- and FLU-treated Ahr+/+ mice, while there was no separation in Ahr-/- mice. Expression of mRNA encoding the bile acid transporter ABCC4 was increased and farnesoid X receptor signaling was inhibited in the livers of Ahr+/+ mice, but not in Ahr-/- mice treated with FLU, in agreement with the observed downstream metabolic alterations. These findings provide new insights into the mechanism of liver injury caused by FLU treatment involving activation of AhR and the alterations of bile acid homeostasis, which could guide clinical application.
Keywords: ABCC4; Aryl hydrocarbon receptor; Bile acid homeostasis; Flutamide; Metabolomics.
Published by Elsevier Inc.
Conflict of interest statement
The authors declare that they have no conflict of interest.
Figures
 ) and FLU (
 ) as determined by PCA. (B) Scores plot of serum metabolome in Ahr-/- mice dosed with vehicle (
) and FLU (
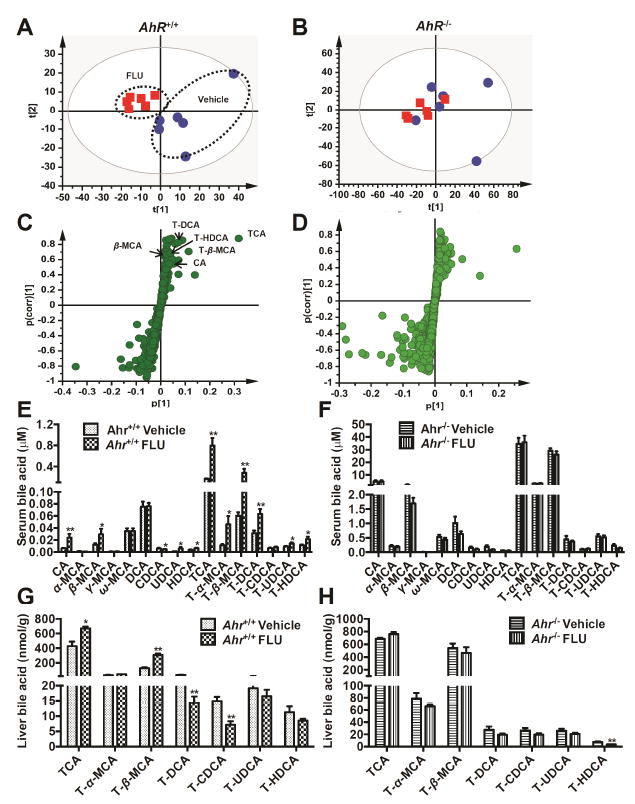
) as determined by PCA. (C) S-plot of OPLS-DA recognized serum metabolome in vehicle- and FLU-treated Ahr+/+ mice, in which identified metabolites were indicated. (D) S-plot of OPLS-DA recognized serum metabolome in vehicle- and FLU-treated Ahr-/- mice. Each point represents an individual mouse serum sample (A, B) and a unique ion (C, D). The t[1] and t[2] represent principal components 1 and 2, respectively. The p(corr)[1] represents the interclass difference, and p[1] represents the relative abundance of the ions. (E-H) Quantitation of bile acids in Ahr+/+ and Ahr-/- mice. (E) Individual bile acids in serum of Ahr+/+ mice. (F) Individual bile acids in serum of Ahr-/- mice. (G) Individual bile acids in livers of Ahr+/+ mice. (H) Individual bile acids in livers of Ahr-/- mice. Data are presented as mean ± SEM; n = 6/group. *P < 0.05, or **P < 0.01, versus vehicle group, by two-tailed Student’s t-test.
) as determined by PCA. (B) Scores plot of serum metabolome in Ahr-/- mice dosed with vehicle (
) and FLU (
) as determined by PCA. (C) S-plot of OPLS-DA recognized serum metabolome in vehicle- and FLU-treated Ahr+/+ mice, in which identified metabolites were indicated. (D) S-plot of OPLS-DA recognized serum metabolome in vehicle- and FLU-treated Ahr-/- mice. Each point represents an individual mouse serum sample (A, B) and a unique ion (C, D). The t[1] and t[2] represent principal components 1 and 2, respectively. The p(corr)[1] represents the interclass difference, and p[1] represents the relative abundance of the ions. (E-H) Quantitation of bile acids in Ahr+/+ and Ahr-/- mice. (E) Individual bile acids in serum of Ahr+/+ mice. (F) Individual bile acids in serum of Ahr-/- mice. (G) Individual bile acids in livers of Ahr+/+ mice. (H) Individual bile acids in livers of Ahr-/- mice. Data are presented as mean ± SEM; n = 6/group. *P < 0.05, or **P < 0.01, versus vehicle group, by two-tailed Student’s t-test.
Similar articles
-
Structure-Activity Relationships of the Main Bioactive Constituents of Euodia rutaecarpa on Aryl Hydrocarbon Receptor Activation and Associated Bile Acid Homeostasis.Drug Metab Dispos. 2018 Jul;46(7):1030-1040. doi: 10.1124/dmd.117.080176. Epub 2018 Apr 24. Drug Metab Dispos. 2018. PMID: 29691238 Free PMC article.
-
Profiling the hepatic effects of flutamide in rats: a microarray comparison with classical aryl hydrocarbon receptor ligands and atypical CYP1A inducers.Drug Metab Dispos. 2006 Jul;34(7):1266-75. doi: 10.1124/dmd.105.009159. Epub 2006 Apr 12. Drug Metab Dispos. 2006. PMID: 16611858
-
Effects of patent ductus venosus on bile acid homeostasis in aryl hydrocarbon receptor (AhR)-null mice.Toxicol Appl Pharmacol. 2020 Sep 15;403:115136. doi: 10.1016/j.taap.2020.115136. Epub 2020 Jul 15. Toxicol Appl Pharmacol. 2020. PMID: 32679164 Free PMC article.
-
Aryl hydrocarbon receptor and NF-E2-related factor 2 are key regulators of human MRP4 expression.Am J Physiol Gastrointest Liver Physiol. 2010 Jul;299(1):G126-35. doi: 10.1152/ajpgi.00522.2010. Epub 2010 Apr 15. Am J Physiol Gastrointest Liver Physiol. 2010. PMID: 20395535 Free PMC article.
-
Picroside II protects against cholestatic liver injury possibly through activation of farnesoid X receptor.Phytomedicine. 2020 Mar;68:153153. doi: 10.1016/j.phymed.2019.153153. Epub 2019 Dec 16. Phytomedicine. 2020. PMID: 32018210
Cited by
-
Emerging Roles of Aryl Hydrocarbon Receptors in the Altered Clearance of Drugs during Chronic Kidney Disease.Toxins (Basel). 2019 Apr 7;11(4):209. doi: 10.3390/toxins11040209. Toxins (Basel). 2019. PMID: 30959953 Free PMC article. Review.
-
Structure-Activity Relationships of the Main Bioactive Constituents of Euodia rutaecarpa on Aryl Hydrocarbon Receptor Activation and Associated Bile Acid Homeostasis.Drug Metab Dispos. 2018 Jul;46(7):1030-1040. doi: 10.1124/dmd.117.080176. Epub 2018 Apr 24. Drug Metab Dispos. 2018. PMID: 29691238 Free PMC article.
-
Aryl hydrocarbon receptor: An emerging player in breast cancer pathogenesis and its potential as a drug target (Review).Mol Med Rep. 2024 Jan;29(1):11. doi: 10.3892/mmr.2023.13134. Epub 2023 Nov 24. Mol Med Rep. 2024. PMID: 37997818 Free PMC article. Review.
-
Novel Aryl Hydrocarbon Receptor Agonist Suppresses Migration and Invasion of Breast Cancer Cells.PLoS One. 2016 Dec 1;11(12):e0167650. doi: 10.1371/journal.pone.0167650. eCollection 2016. PLoS One. 2016. PMID: 27907195 Free PMC article.
-
Latent Variables Capture Pathway-Level Points of Departure in High-Throughput Toxicogenomic Data.Chem Res Toxicol. 2022 Apr 18;35(4):670-683. doi: 10.1021/acs.chemrestox.1c00444. Epub 2022 Mar 25. Chem Res Toxicol. 2022. PMID: 35333521 Free PMC article.
References
-
- Wysowski DK, Fourcroy JL. Flutamide hepatotoxicity. The Journal of urology. 1996;155:209–212. - PubMed
-
- Manso G, Thole Z, Salgueiro E, Revuelta P, Hidalgo A. Spontaneous reporting of hepatotoxicity associated with antiandrogens: data from the Spanish pharmacovigilance system. Pharmacoepidemiol Drug Saf. 2006;15:253–259. - PubMed
-
- Thole Z, Manso G, Salgueiro E, Revuelta P, Hidalgo A. Hepatotoxicity induced by antiandrogens: A review of the literature. Urologia internationalis. 2004;73:289–295. - PubMed
-
- Takakusa H, Masumoto H, Yukinaga H, Makino C, Nakayama S, Okazaki O, Sudo K. Covalent binding and tissue distribution/retention assessment of drugs associated with idiosyncratic drug toxicity. Drug Metabolism and Disposition. 2008;36:1770–1779. - PubMed
-
- Coe KJ. Metabolism and Cytotoxicity of the Nitroaromatic Drug Flutamide and Its Cyano Analog in Hepatocyte Cell Lines. ProQuest. 2008
MeSH terms
Substances
Grants and funding
LinkOut - more resources
Full Text Sources
Other Literature Sources
