. 2017 Feb 15;81(4):285-295.
doi: 10.1016/j.biopsych.2016.06.012. Epub 2016 Jun 18.

Ketamine and Imipramine Reverse Transcriptional Signatures of Susceptibility and Induce Resilience-Specific Gene Expression Profiles

Affiliations

Ketamine and Imipramine Reverse Transcriptional Signatures of Susceptibility and Induce Resilience-Specific Gene Expression Profiles

Rosemary C Bagot et al. Biol Psychiatry. .

Abstract

Background: Examining transcriptional regulation by antidepressants in key neural circuits implicated in depression and understanding the relation to transcriptional mechanisms of susceptibility and natural resilience may help in the search for new therapeutic agents. Given the heterogeneity of treatment response in human populations, examining both treatment response and nonresponse is critical.

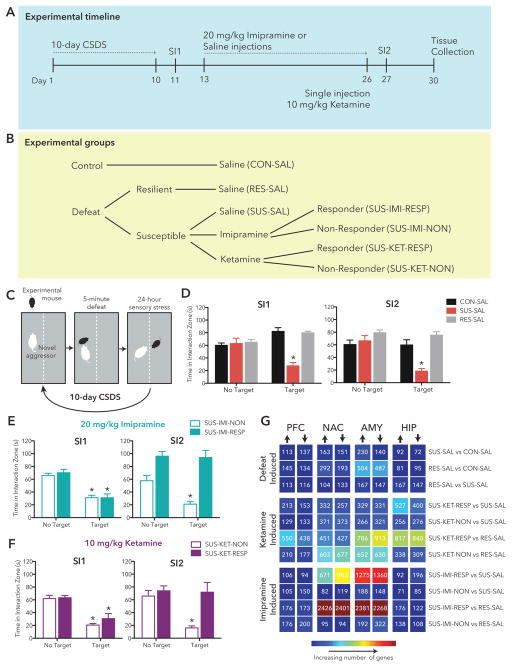
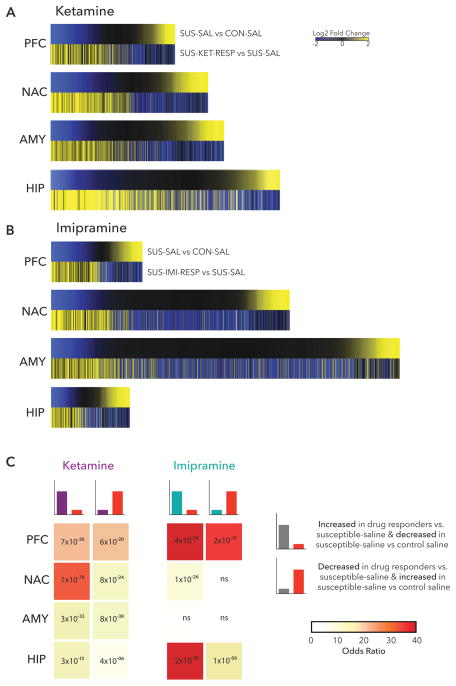
Methods: We compared the effects of a conventional monoamine-based tricyclic antidepressant, imipramine, and a rapidly acting, non-monoamine-based antidepressant, ketamine, in mice subjected to chronic social defeat stress, a validated depression model, and used RNA sequencing to analyze transcriptional profiles associated with susceptibility, resilience, and antidepressant response and nonresponse in the prefrontal cortex (PFC), nucleus accumbens, hippocampus, and amygdala.

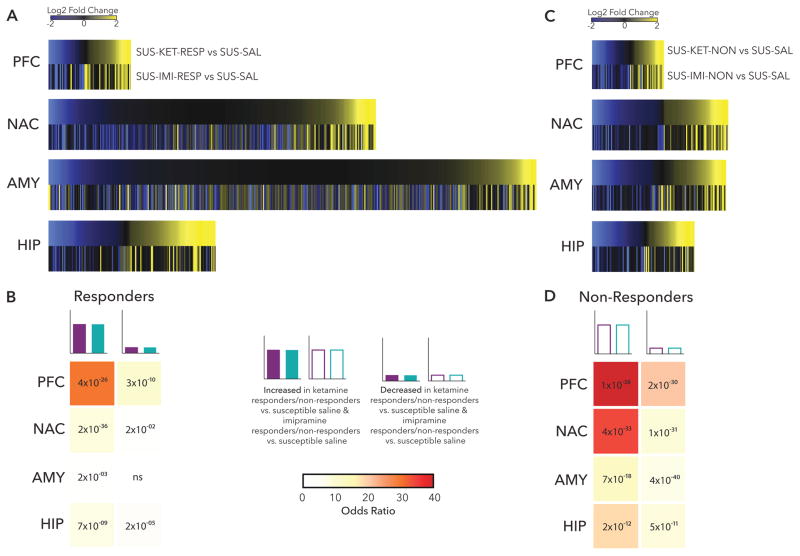
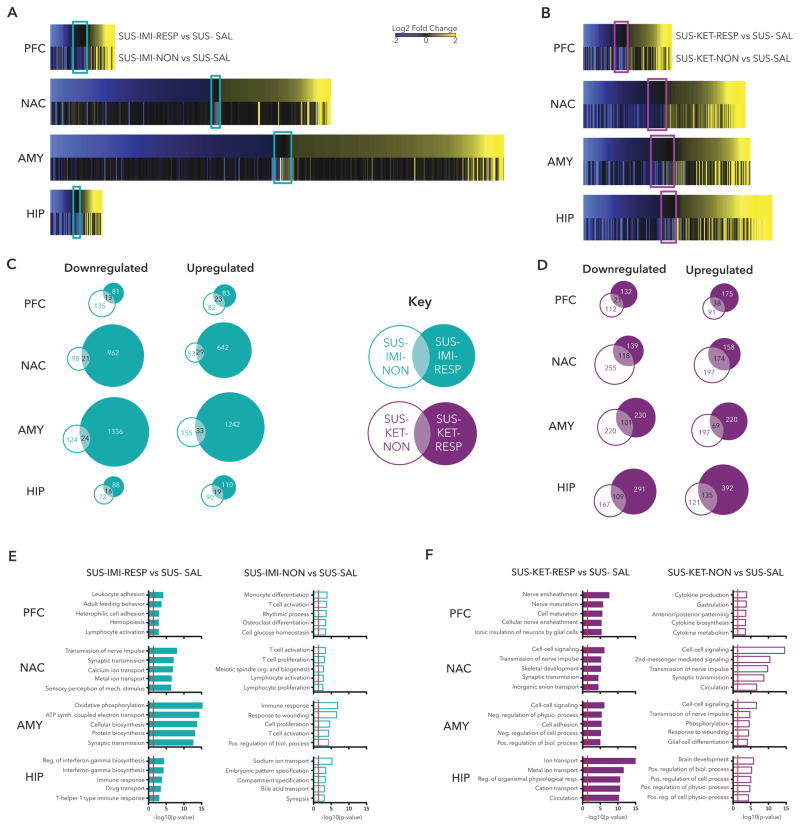
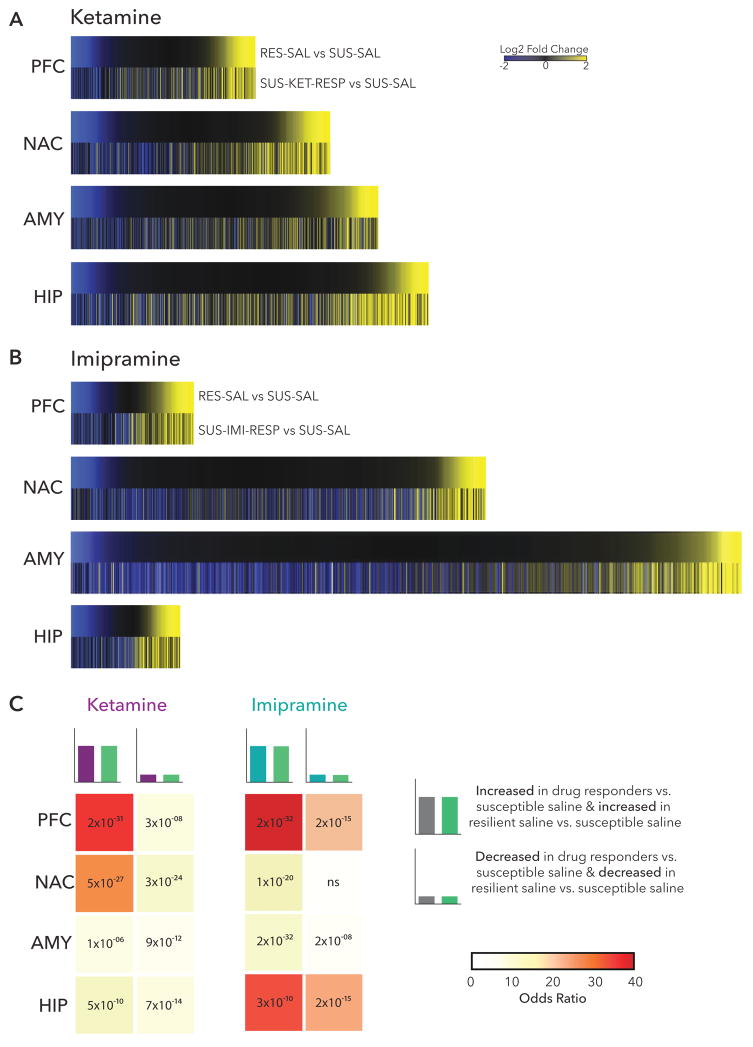
Results: We identified similar numbers of responders and nonresponders after ketamine or imipramine treatment. Ketamine induced more expression changes in the hippocampus; imipramine induced more expression changes in the nucleus accumbens and amygdala. Transcriptional profiles in treatment responders were most similar in the PFC. Nonresponse reflected both the lack of response-associated gene expression changes and unique gene regulation. In responders, both drugs reversed susceptibility-associated transcriptional changes and induced resilience-associated transcription in the PFC.

Conclusions: We generated a uniquely large resource of gene expression data in four interconnected limbic brain regions implicated in depression and its treatment with imipramine or ketamine. Our analyses highlight the PFC as a key site of common transcriptional regulation by antidepressant drugs and in both reversing susceptibility- and inducing resilience-associated molecular adaptations. In addition, we found region-specific effects of each drug, suggesting both common and unique effects of imipramine versus ketamine.

Keywords: Depression; Imipramine; Ketamine; RNA-seq; Resilience; Susceptibility.


Figures

Figure 1
Figure 1. Study Overview
(a) Schematic outlining study design and experimental manipulations. (b) Social interaction data 24h post CSDS and again following drug treatment. (c) The number of DEGs in each pair-wise comparison (p<0.05) is displayed in the matrix with warmer colors indicating increasing numbers of DEGs. Time spent in the interaction zone in the absence (No Target) or presence (Target) of a novel mouse 24h after CSDS (SI1) and 24h following 14 daily injections (SI2) in: (d) saline (SAL) treated control (CON), susceptible (SUS) and resilient (RES) mice, (e) imipramine (IMI) treated susceptible responders (RESP) and non-responders (NON) and (f) ketamine (KET) treated susceptible responders (RESP) and non-responders (NON). (g) Table summarizes number of differentially expressed genes (p<0.05, FC>1.3; DEGs) in each pair-wise comparison in each brain region with warmer colors representing increasing numbers of DEGs and text indicating exact number.
Figure 2
Figure 2. Characterization of Treatment Response & Non-Response
(a) Heatmaps show the union of ketamine response (SUS-KET-RESP vs. SUS-SAL) and imipramine response (SUS-IMI-RESP vs. SUS-SAL) DEGs rank ordered by log2 fold changes of ketamine response and scaled by relative number of DEGs. (b) Table of p-value (text) and odds ratio (warmer colors indicating increasing odds ratio) for Fisher’s exact test for enrichment of ketamine response DEGs in imipramine response DEGs. (c) Heatmaps show the union of ketamine non-response (SUS-KET-NON vs. SUS-SAL) and imipramine non-response (SUS-IMI-NON vs. SUS-SAL) DEGs rank ordered by log2 fold changes of ketamine non-response and scaled by relative number of DEGs. (d) Table of p-value (text) and odds ratio (warmer colors indicating increasing odds ratio) for Fisher’s exact test for enrichment of ketamine non-response DEGs in imipramine non-response DEGs. *p<0.05
Figure 3
Figure 3. Comparison of Treatment Response and Non-Response
(a) Heatmaps show the union of ketamine response DEGs (SUS-KET-RESP vs. SUS-SAL) and ketamine non-response DEGs (SUS-KET-NON vs. SUS-SAL) in each brain region rank ordered by log2 fold changes of ketamine response and scaled by relative number of DEGs. (b) Heatmaps show the union of imipramine response DEGs (SUS-IMI-RESP vs. SUS-SAL) and imipramine non-response DEGs (SUS-IMI-NON vs. SUS-SAL) in each brain region, rank ordered by log2 fold changes of imipramine response and scaled by relative number of DEGs. Colored rectangles highlight DEGs significantly regulated exclusively in non-responders and not in responders. (c) Venn diagrams represent the number of common and unique downregulated (left panel) and upregulated (right panel) DEGs in imipramine responders and non-responders in each brain region. (d) Venn diagrams represent the number of common and unique downregulated (left panel) and upregulated (right panel) DEGs in ketamine responders and non-responders in each brain region. (e) Bar graphs show biological pathways enriched in DEGs in imipramine responders (left panel) and non-responders (right panel). (f) Bar graphs show biological pathways enriched in DEGs in ketamine responders (left panel) and non-responders (right panel). Red line indicates p=0.05.
Figure 4
Figure 4. Induction of Resilience DEGs with Treatment Response
(a) Heatmaps show the union of ketamine response (SUS-KET-RESP vs. SUS-SAL) and resilience (RES-SAL vs. SUS-SAL) DEGs in each brain region rank ordered by log2 fold changes of resilience and scaled by relative number of DEGs. (b) Heatmaps show the union of imipramine response (SUS-IMI-RESP vs. SUS-SAL) and resilience (RES-SAL vs. SUS-SAL) DEGs in each brain region rank ordered by log2 fold changes of resilience and scaled by relative number of DEGs. (c) Table of p-value (text) and odds ratio (warmer colors indicating increasing odds ratio) for Fisher’s exact test for enrichment of ketamine response and imipramine response DEGs with resilience DEGs.
Figure 5
Figure 5. Reversal of Susceptibility DEGs with Treatment Response
(a) Heatmaps show the union of ketamine response (SUS-KET-RESP vs. SUS-SAL) and susceptibility (SUS-SAL vs. CON-SAL) DEGs in each brain region rank ordered by log2 fold changes of susceptibility and scaled by relative number of DEGs. (b) Heatmaps show the union of imipramine response (SUS-IMI-RESP vs. SUS-SAL) and susceptibility (SUS-SAL vs. CON-SAL) DEGs in each brain region rank ordered by log2 fold changes of susceptibility and scaled by relative number of DEGs. (c) Table of p-value (text) and odds ratio (warmer colors indicating increasing odds ratio) for Fisher’s exact test for enrichment of ketamine response and imipramine response DEGs with susceptible DEGs.

Comment in

References

    1. Greenberg PE, Fournier AA, Sisitsky T, Pike CT, Kessler RC. The economic burden of adults with major depressive disorder in the United States (2005 and 2010) The Journal of clinical psychiatry. 2015;76:155–162. - PubMed
    1. Block SG, Nemeroff CB. Emerging antidepressants to treat major depressive disorder. Asian journal of psychiatry. 2014;12:7–16. - PubMed
    1. Krishnan V, Nestler EJ. The molecular neurobiology of depression. Nature. 2008;455:894–902. - PMC - PubMed
    1. Duric V, Duman RS. Depression and treatment response: dynamic interplay of signaling pathways and altered neural processes. Cellular and molecular life sciences : CMLS. 2013;70:39–53. - PMC - PubMed
    1. Murrough JW, Iosifescu DV, Chang LC, Al Jurdi RK, Green CE, Perez AM, et al. Antidepressant efficacy of ketamine in treatment-resistant major depression: a two-site randomized controlled trial. The American journal of psychiatry. 2013;170:1134–1142. - PMC - PubMed

Publication types

MeSH terms