. 2017 Jan;14(1):90-107.
doi: 10.1038/cmi.2016.41. Epub 2016 Aug 29.

CD4 and CD8 T cells mediate distinct lethal meningoencephalitis in mice challenged with Tacaribe arenavirus

Affiliations

CD4 and CD8 T cells mediate distinct lethal meningoencephalitis in mice challenged with Tacaribe arenavirus

Derek Dc Ireland et al. Cell Mol Immunol. 2017 Jan.

Abstract

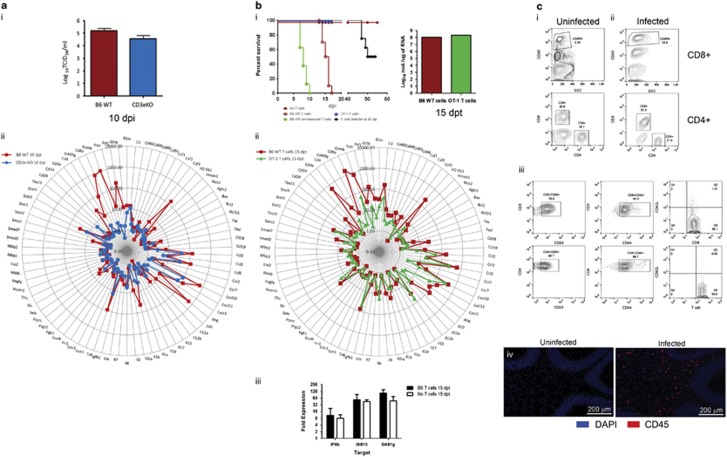
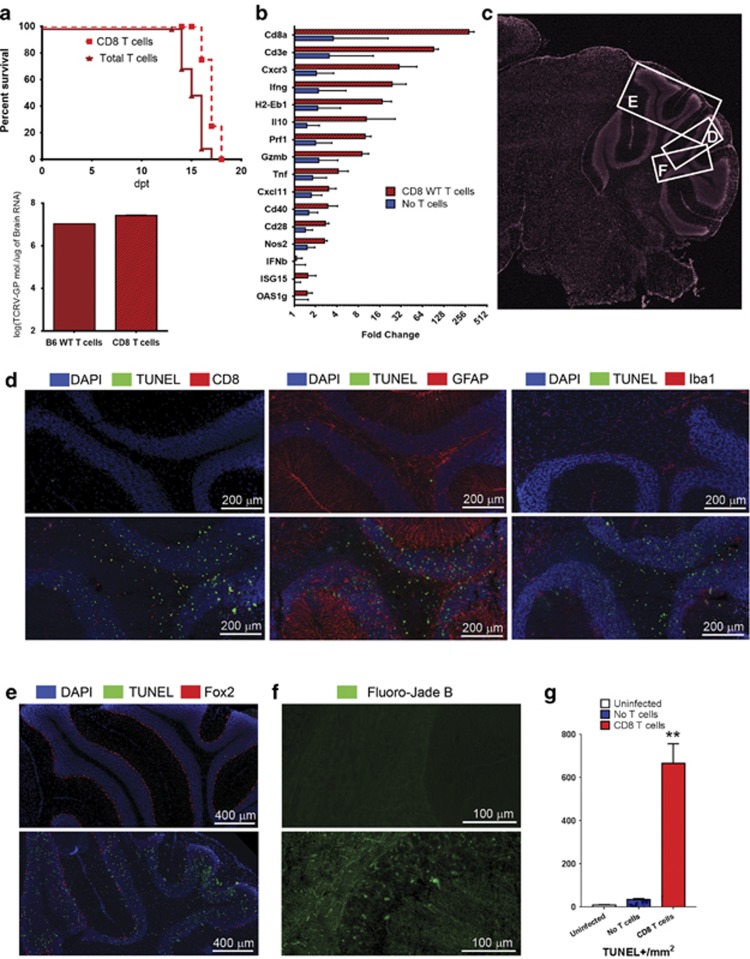
Neonates are at increased risk of viral encephalopathies that can result in neurological dysfunction, seizures, permanent disability and even death. The neurological damage results from the combined effect of the virus and the immune response it elicits, thus finding tools to facilitate viral clearance from central nervous system (CNS) while minimizing neuron damage remains a critical challenge. Neonatal mice inoculated intraperitoneally with Tacaribe virus (TCRV) develop seizures, hindlimb paralysis and death within 15 days of inoculation. TCRV localizes to the CNS within days of challenge, primarily infecting astrocytes in the cerebellum and brain stem. We show that infection leads to inflammation, T cell and monocyte infiltration into the cerebellar parenchyma, apoptosis of astrocytes, neuronal degeneration and loss of Purkinje cells. Infiltrating antigen-specific T cells fail to clear the virus but drive the disease, as T-cell-deficient CD3ɛ KO mice survive TCRV infection with minimal inflammation or clinical manifestations despite no difference in CNS viral loads in comparison with T-cell sufficient mice. CD8+ T cells drive the pathology, which even in the absence of CD4+ T-cell help, infiltrate the parenchyma and mediate the apoptotic loss of cerebellar astrocytes, neurodegeneration and loss of Purkinje cells resulting in loss of balance, paralysis and death. CD4+ T cells are also pathogenic inducing gliosis and inflammation in the cerebellum and cerebrum that are associated with wasting and death several weeks after CD4+ T-cell transfer. These data demonstrate distinct pathogenic effects of CD4+ and CD8+ T cells and identify them as possible therapeutic targets.


Figures

Figure 1
Figure 1
TCRV infection results in CNS inflammation, apoptosis and neurodegeneration. (a) Survival of C57BL/6 (B6 WT) mice infected with 2000 × TCID50 TCRV, i.p. (b) Relative quantification of gene expression in the CNS of B6 WT mice at 10 dpi: (i) chemokines, (ii) antigen presentation, (iii) cytokines and (iv) T-cell-related genes. Gene expression was normalized using GAPDH and expressed as fold change in gene expression relative to age-matched uninfected controls (log2 scale; n=6 mice per group). (c) Apoptosis in the hindbrain of B6 WT animals at 10 dpi (right) as detected by the TUNEL assay (coronal sections). (i) Whole section image (4′6-Diamidino-2-Pheylindole (DAPI)), with box indicating location of imaging in (ii) and (iii). (ii) Uninfected, age-matched cerebellum at P13. (iii) TCRV-infected WT mice at 10 dpi (age=P13). TUNEL-positive cells (green) co-stained for neurons (anti-NeuN), astrocytes (anti-GFAP), microglia (anti-Iba-1) or CD45+ infiltrating cells (all shown in red). Arrows in (ciii) indicate GFAP+TUNEL+ cells or CD45+TUNEL+ cells, respectively. Scale bars: (ii) and left column of (iii)=200 μm; right column of (iii)=100 μm. Inset, GFAP+TUNEL+ cells, scale bar=50 μm. (d) Hematoxylin and eosin of uninfected and TCRV-infected CNS collected at 10 dpi (sagittal sections). Scale bar=100 μm. (e) TUNEL (green) and Purkinje cells (α-Fox2, red) in the cerebellum (coronal sections; scale bar=400 μm) of age-matched uninfected (left column) and TCRV-infected mice (10 dpi). (f) Fluor-Jade B stain for degenerative neurons (green). (g) Quantification of TUNEL, Fluoro-Jade B and Fox2+ cells. The mean number of cells/mm2 counted in at least five fields of view per section from at least two mice. Statistical significance denoted as *P<0.05; **P<0.01. Abbreviations: CNS, central nervous system; TCRV, Tacaribe virus; WT, wild type; TUNEL, terminal deoxynucleotidyl transferase dUTP nick end labeling.
Figure 2
Figure 2
Characterization of cellular infiltration and microglial activation in CNS of infected mice and the activation of microglia. (a) CNS cells isolated from age-matched TCRV-infected and uninfected controls (left) mice at 10 dpi (right) were analyzed by flow cytometry. Populations are described as percentages of the parent population (SSC-H, side scatter). The gating strategy shown in Supplementary Figure S1. Data are representative of at least three independent experiments, and >4 mice were pooled for each experiment. (b) IF-IHC of immune cells in the cerebellum (coronal sections, same anatomical location as Figure 1c) at 10 dpi. Images are representative of six mice from two independent experiments). Scale bar=200 μm. Abbreviations: CNS, central nervous system; IF-IHC, immunofluorescence immunohistochemistry; TCRV, Tacaribe virus.
Figure 3
Figure 3
T cells infiltrate the TCRV-infected CNS and drive inflammation and disease. (a) TCRV induced encephalitis in T-cell-deficient mice. (i) Viral loads in CNS of infected WT or CD3ɛ KO mice at 10 dpi as determined by TCID50 assay. (ii) Changes in gene expression in CNS of TCRV-infected B6 WT (red) or CD3ɛ KO mice (blue) relative to uninfected age/strain-matched controls as determined by TLDA at day 10 dpi (n=4/group). (b) Transfer of T cells restored pathology in CD3ɛ KO mice. (i) Left: Survival curve of mice infected on P3 and receiving 2 × 10⁶ T cells at 7 dpi from naïve B6 WT mice (WT T cells), B6 WT mice pre-exposed to TCRV (B6 WT convalescent T cells), naïve OT-1 tg mice (OT-1 T cells). Alternatively CD3ɛ KO mice were transferred with naïve T cells 30 dpi (T-cell transfer at 30 dpi). Controls (no T cells) include infected mice that did not receive a T-cell transfer (N=>8 mice per group). Right: Viral loads in infected CD3ɛ KO mice that received OT-1 tg T cells (green) or B6 WT T cells (red) at 7 dpi as determined by quantitative real-time PCR of TCRV-GP (N=6/group). (ii) Relative changes in gene expression at 15 dpt in infected mice that received B6 WT and OT-1 tg T cell relative to age-matched, uninfected, untreated CD3ɛ KO mice (n=3/group) and normalized to the expression of GAPDH. (iii) Changes in mRNA expression for IFN-β and representative interferon-stimulated genes in the CNS of TCRV-infected CD3ɛ KO mice that received T cells from naïve B6 WT mice (B6 T cells 15 dpi) compared with TCRV-infected CD3ɛ KO mice that did not receive T cells. Values expressed as fold changes over those of uninfected CD3ɛ KO controls (N=6 per group). (c) Flow cytometry on cells isolated from the CNS of CD3ɛ KO that received T-cell transfers at 15 dpt (representative of three independent experiments, each with cells pooled from >4 mice). (i) Age-matched uninfected control mice receiving naïve T cells. (ii) Cells isolated from CNS of TCRV-infected, CD3ɛ KO T-cell recipient mice. (iii) Gated on CD45hi populations (ii), phenotyping of CD8+ (top row) and CD4+ (bottom row) for expression of CD69, CD44 and CD62L, respectively. (iv) IF-IHC of infiltrating cells (CD45+, red) in the cerebellum (sagittal sections) of uninfected (top) or infected (bottom) naïve B6 WT T-cell recipients at 15 dpt. Abbreviations: CNS, central nervous system; IF-IHC, immunofluorescence immunohistochemistry; IFN-β, interferon beta; TCRV, Tacaribe virus; TLDA,TaqMan low-density arrays; WT, wild type.
Figure 4
Figure 4
T cells play a role in apoptosis and neurodegeneration. (a) Whole-cerebellum image (sagittal section, 4′6-Diamidino-2-Pheylindole (DAPI)), with boxes indicating location of imaging for b–d). (b) Representative sections from cerebella of uninfected CD3ɛ KO that received total WT T cells (T cells), untreated age-matched TCRV-infected CD3ɛ KO mice (TCRV) and TCRV-infected CD3ɛ KO mice that received total WT T cells at 7 dpi (TCRV+ T cells). Cells undergoing apoptosis labeled with TUNEL+ in green, neuron (anti-NeuN), astrocyte (anti-GFAP) and microglia (anti-Iba-1) in red. Scale bars=200 μm (3 columns on left) or 100 μm (column on right). (c) Apoptosis of Purkinje cells (TUNEL+ cells shown in green and anti-Fox2+ in red). Scale bar=400 μm. (d) Fluoro-Jade B stain for degenerative neurons (green). Scale bar=100 μm. Images are representative of N=4 animals, in two independent experiments. (e) Quantification of TUNEL+ and Fox2+ cells. The mean number of cells/mm2 counted in at least five fields of view per section from at least two mice. Statistical significance denoted as *P<0.05, **P<0.01. Abbreviations: TCRV, Tacaribe virus; TUNEL, terminal deoxynucleotidyl transferase dUTP nick end labeling; WT, wild type.
Figure 5
Figure 5
CD8 T cells are associated with apoptosis and acute neuronal disruption. (a) Survival curve (left) and viral load (right) of CD3ɛ KO mice that received purified CD8+ T cells (circle) or total T cells (squares) from naïve B6 WT mice. Absolute quantification of TCRV-GP transcripts in the CNS of infected B6 WT total and CD8+ T-cell recipients was determined at 15 dpt. (b) Relative gene expression in the CNS of TCRV-infected CD3ɛ KO mice receiving CD8+ T cells. Data are expressed as mean fold-change over the average of age-matched, TCRV-infected untransferred CD3KO controls (n=6 per group) and normalized to the house keeping gene, GAPDH. Error bars=s.e.m. (c) Whole-cerebellum image (sagittal sections, 4′6-Diamidino-2-Pheylindole (DAPI)), with boxes indicating location of imaging for df). (df) Sections from uninfected CD3ɛ KO receiving CD8+ T cells at P10 (left) and TCRV-infected CD3ɛ KO receiving CD8+ T cells at 15 dpt, stained for: (d) TUNEL+ cells (green), combined with anti-CD8 (T cells); astrocyte (anti-GFAP) or microglia (anti-Iba-1) staining (red). Scale bar=200 μm. (e) TUNEL+ cells (green), combined with Purkinje cells (anti-Fox2). Scale bar=400 μm. (f) Fluoro-Jade B stain for degenerative neurons (green). Scale bar=100 μm. Images are representative of N=4 animals, in two independent experiments. (g) Quantification of TUNEL+ cells. The mean number of cells/mm2 counted in at least five fields of view per section from at least two mice. Statistical significance denoted as **P<0.01. Abbreviations: CNS, central nervous system; TCRV, Tacaribe virus; TUNEL, terminal deoxynucleotidyl transferase dUTP nick end labeling; WT, wild type.
Figure 6
Figure 6
CD4+ T cells are associated with CNS activated microglia but not apoptosis. (a) Survival curve (left) and viral load (right) of CD3ɛ KO mice that received purified CD4+ T cells (circle) or total T cells (squares) from naïve B6 WT mice. Absolute quantification of TCRV-GP transcripts in the CNS of infected B6 WT total and CD4+ T-cell recipients was determined at 15 dpt. (b) Relative gene expression in the CNS of TCRV-infected CD3ɛ KO mice receiving CD4+ T cells. Data are expressed as mean fold-change over the average of age-matched, infected untransferred CD3KO controls (n=6 per group) and normalized to the house keeping gene, GAPDH. Error bars=s.e.m. (c) Whole-cerebellum image (4′6-Diamidino-2-Pheylindole (DAPI)), with boxes indicating location of imaging for d–f). (df) Sagittal sections from uninfected CD3ɛ KO CD4+ T-cell recipients at P25 (left) and TCRV-infected CD3ɛ KO CD4+ T cells recipients at 15 dpt, stained for: (d) TUNEL+ cells (green), combined with anti-CD4 (T cells); GFAP (astrocytes), or Iba-1 (microglia) staining. Scale bar=200 μm. (e) TUNEL+ cells (green) and Fox2 (Purkinje cells). Scale bar=400 μm. (f) Floro-Jade B stain for degenerative neurons (green). Scale bar=100 μm. Images are representative of N=4 animals, in two independent experiments. (g) Quantification of TUNEL+ cells. The mean number of cells/mm2 counted in at least five fields of view per section from at least two mice. Abbreviations: CNS, central nervous system; TCRV, Tacaribe virus; TUNEL, terminal deoxynucleotidyl transferase dUTP nick end labeling; WT, wild type.
Figure 7
Figure 7
Widespread gliosis and neural disruption but no apoptosis at 28 dpt in mice receiving CD4+ T cells. Top. Sagittal section of CNS (4′6-Diamidino-2-Pheylindole (DAPI)) with boxes indicating location of imaging for the cerebellum (a) and the cerebral cortex (b) IF-IHC compares staining in uninfected, (P35, left) and TCRV-infected (28 dpt, right) CD4+ T cells recipients. Images representative of three mice per group with similar results. IF-IHC was performed as described in Figures 5 and 6. Scale bar=200 μm for all but Fluoro-Jade B staining, Scale bar=100 μm. Abbreviations: CNS, central nervous system; IF-IHC, immunofluorescence immunohistochemistry; TCRV, Tacaribe virus.

Similar articles

Cited by

References

    1. Bowen M, Peters CJ, Nichol ST. The phylogeny of New World (Tacaribe complex) arenaviruses. Virology 1996; 219: 285–290. - PubMed
    1. Salvato MS, Charrel RN, Clegg JCS, Buchmeier MJ, Gonzalez JP, Lukashevich IS et alFamily arenaviridae. In: Regenmortel MHV, van Fauquet CM, Bishop CM (eds). Virus Taxonomy, 8th edn. Academic Press: Orlando. 2004, pp 633–640.
    1. Martinez-Peralta LA, Coto CE, Weissenbacher MC. The Tacaribe complex—the close relationship between a pathogenic (Junin) and a nonpathogenic (Tacaribe) arenavirus. In: Salvato M (ed.) The Arenaviridae, 1st edn. Plenun Press: New York. 1993, pp 281–298.
    1. Enria DA, Briggiler AM, Sanchez Z. Treatment of Argentine hemorrhagic fever. Antiviral Res 2008; 78: 132–139. - PMC - PubMed
    1. Charrel RN, de Lamballerie X. Arenaviruses other than Lassa virus. Antiviral Res 2003; 57: 89–100. - PubMed

Publication types

MeSH terms