. 2016 Sep:11:183-198.
doi: 10.1016/j.ebiom.2016.08.014. Epub 2016 Aug 14.

SIAH and EGFR, Two RAS Pathway Biomarkers, are Highly Prognostic in Locally Advanced and Metastatic Breast Cancer

Affiliations

SIAH and EGFR, Two RAS Pathway Biomarkers, are Highly Prognostic in Locally Advanced and Metastatic Breast Cancer

Lauren L Siewertsz van Reesema et al. EBioMedicine. 2016 Sep.

Abstract

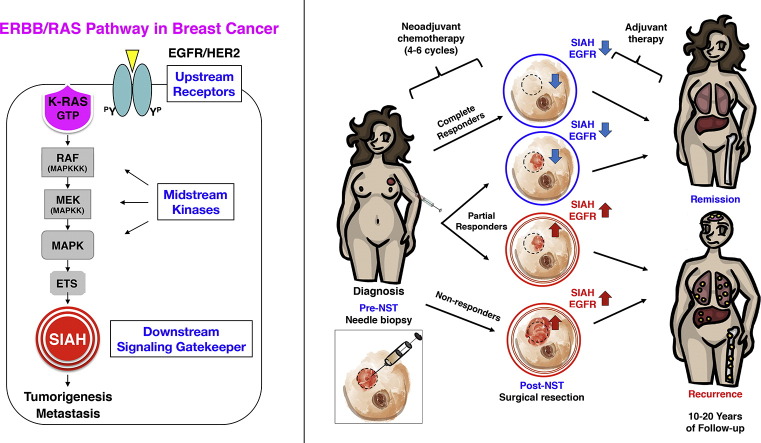
Background: Metastatic breast cancer exhibits diverse and rapidly evolving intra- and inter-tumor heterogeneity. Patients with similar clinical presentations often display distinct tumor responses to standard of care (SOC) therapies. Genome landscape studies indicate that EGFR/HER2/RAS "pathway" activation is highly prevalent in malignant breast cancers. The identification of therapy-responsive and prognostic biomarkers is paramount important to stratify patients and guide therapies in clinical oncology and personalized medicine.

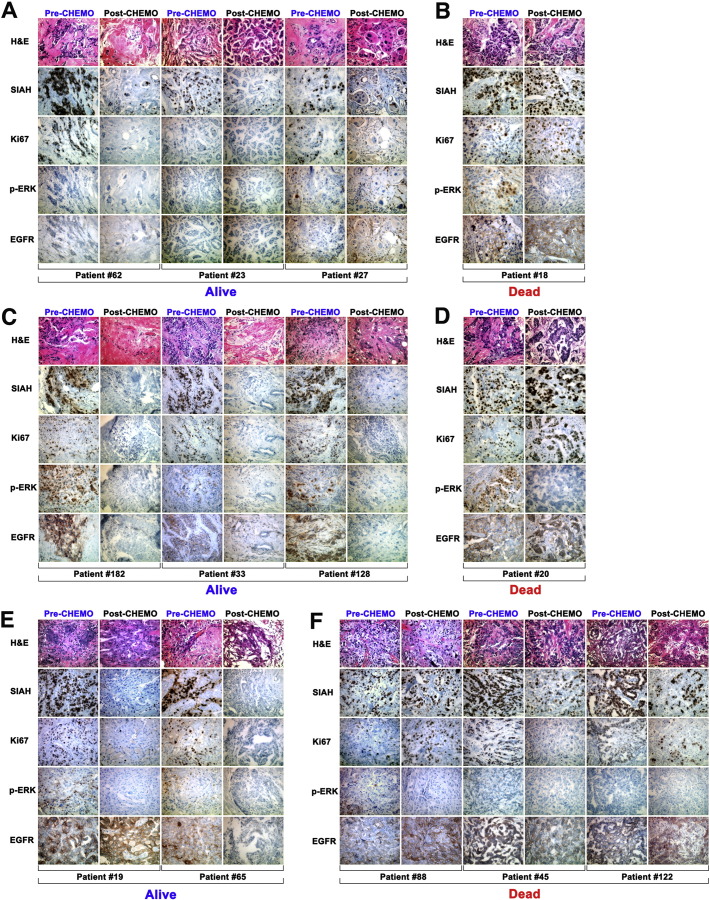
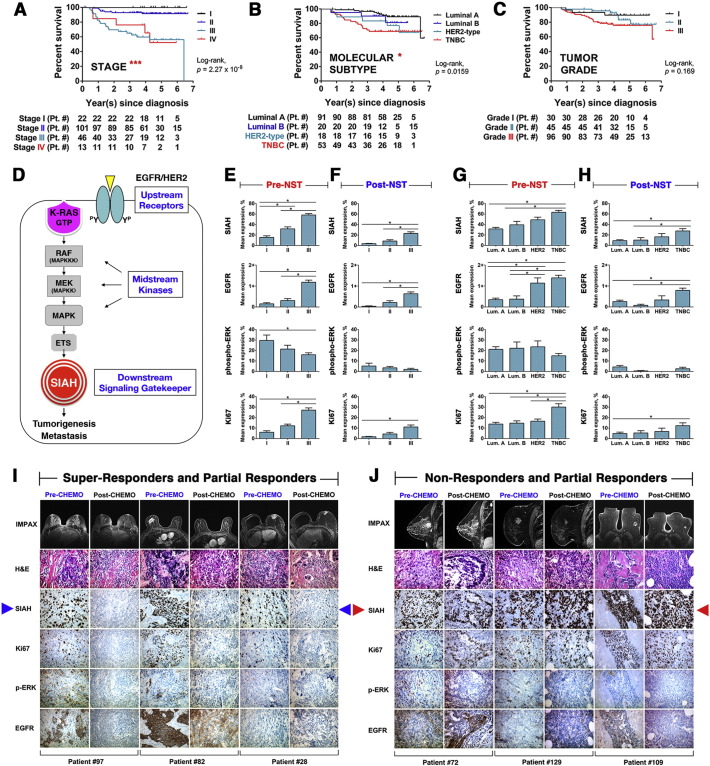
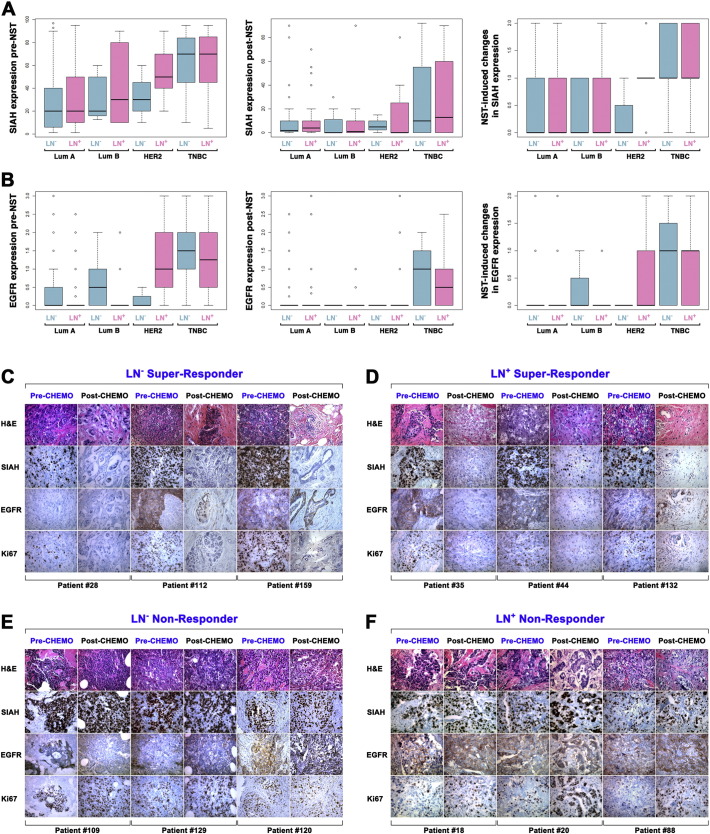
Methods: In this study, we analyzed matched pairs of tumor specimens collected from 182 patients who received neoadjuvant systemic therapies (NST). Statistical analyses were conducted to determine whether EGFR/HER2/RAS pathway biomarkers and clinicopathological predictors, alone and in combination, are prognostic in breast cancer.

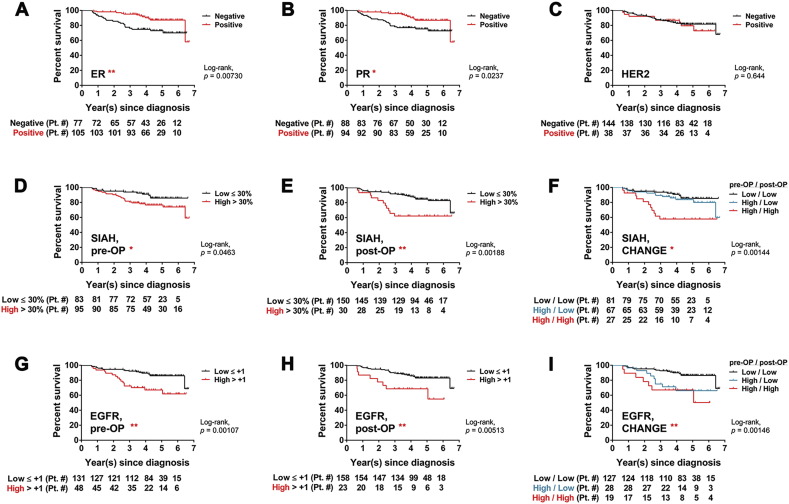
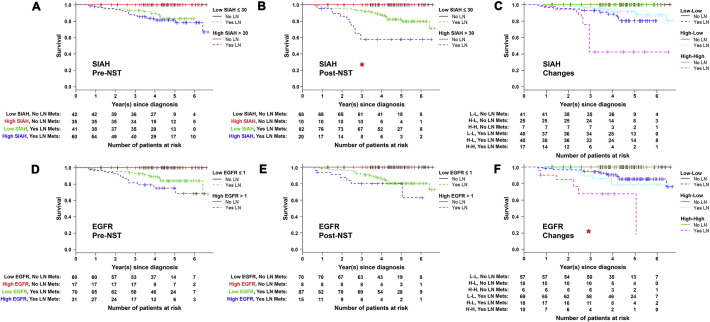
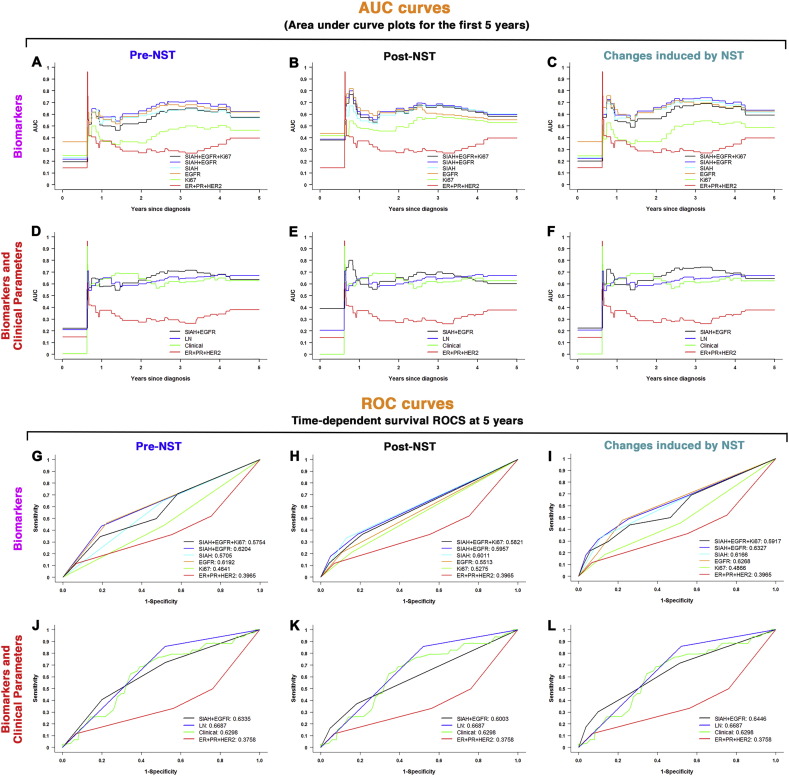
Findings: SIAH and EGFR outperform ER, PR, HER2 and Ki67 as two logical, sensitive and prognostic biomarkers in metastatic breast cancer. We found that increased SIAH and EGFR expression correlated with advanced pathological stage and aggressive molecular subtypes. Both SIAH expression post-NST and NST-induced changes in EGFR expression in invasive mammary tumors are associated with tumor regression and increased survival, whereas ER, PR, and HER2 were not. These results suggest that SIAH and EGFR are two prognostic biomarkers in breast cancer with lymph node metastases.

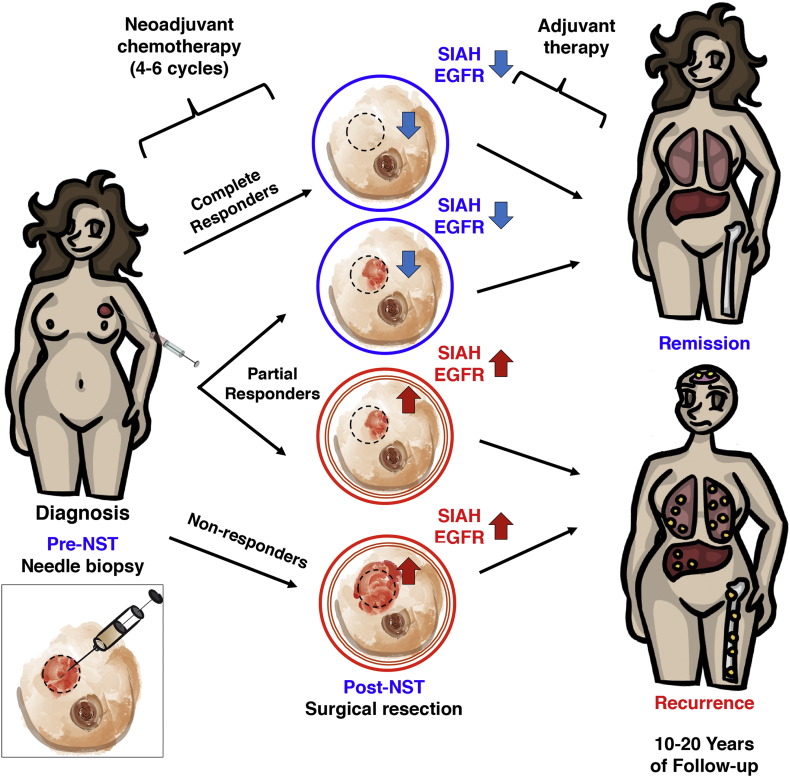
Interpretation: The discovery of incorporating tumor heterogeneity-independent and growth-sensitive RAS pathway biomarkers, SIAH and EGFR, whose altered expression can be used to estimate therapeutic efficacy, detect emergence of resistant clones, forecast tumor regression, differentiate among partial responders, and predict patient survival in the neoadjuvant setting, has a clear clinical implication in personalizing breast cancer therapy.

Funding: This work was supported by the Dorothy G. Hoefer Foundation for Breast Cancer Research (A.H. Tang); Center for Innovative Technology (CIT)-Commonwealth Research Commercialization Fund (CRCF) (MF14S-009-LS to A.H. Tang), and National Cancer Institute (CA140550 to A.H. Tang).

Keywords: And prognostic biomarkers; Clinicopathological predictors; Locally advanced and metastatic breast cancer; Needle biopsies; Neoadjuvant systemic therapies; SIAH E3 ligase; The RAS pathway activation in breast cancer.


Figures

Image 1
Graphical abstract
Supplementary Fig. S1
Low or high SIAH and/or EGFR expression post-NST is associated with increased or reduced patient survival in breast cancer at 5 years Representative results from immunohistochemical analyses of patients who were alive at 5-year post-NST (A, C, and E), or who were dead at 5-year post-NST (B, D, and F). Patients with luminal-type breast tumors (A and B), HER2-positive breast tumors (C and D), or triple negative breast cancer (E and F). (A, C and E) Loss of SIAH expression post NST correlates with increased patient survival. Persistent high SIAH or high EGFR expression post-NST is associated with decreased patient survival. For all mammary tumor subtypes, patients who survived for longer than 5 years had low or markedly reduced level of SIAH expression post-NST, than patients who succumbed in less than 5 years.
Fig. 1
Fig. 1
Two RAS pathway biomarkers, SIAH and EGFR, whose expression in breast cancer correlated with increased tumor grades and aggressive molecular subtypes pre- and post-NST. (A) Pathological stages are statistically associated with patient survival with P value of 2.27 × 10− 8. (B) Molecular subtypes are statistically associated with patient survival with P value of 0.016. (C) Tumor grade are not associated with patient survival. (D) A schematic illustration of the EGFR/HER2/RAS signaling pathway is shown. The expression of the two upstream receptors, EGFR/HER2, the midstream kinases, phospho-ERK, and the most downstream signaling gatekeeper, SIAH E3 ligase, were examined. (E–F) Levels of SIAH, EGFR, and Ki67 expression in breast cancer increased with tumor grades, pre- and post-NST. NST significantly reduced levels of EGFR, SIAH, phospho-ERK, and Ki67. (G–H) Levels of SIAH, EGFR, and Ki67 expression increased in aggressive molecular subtypes of mammary tumors, pre- and post-NST. Levels of phospho-ERK expression were not correlated with molecular subtypes. NST significantly reduced levels of EGFR, SIAH, phospho-ERK, and Ki67, in a majority of resected primary mammary tumors. (I–J) Radiographic (MRI) images of human breasts and breast cancer pre- and post-NST were shown. Treatment-naïve tumor cells in high-grade and high-risk mammary tumors expressed high SIAH. (I) Fewer tumor cells expressed high SIAH post-NST. Based on diminished SIAH expression, we categorized patients as super-responders, whose tumor regressed completely post-NST. Three patients had dramatic reductions in SIAH expression (marked by blue arrows); more than 95% of tumor cells expressed SIAH pre-NST, compared with less than 1% tumor cells expressed SIAH post-NST. These patients had no evidence of tumor recurrence 7 years post-NST. (J) Three patients whose tumors had a high SIAH expression post-NST (marked by red arrows) were categorized as non-responders, whose tumors regress less than 20-30% post-NST, and who had shortened survival time due to progressive diseases and LN metastases.
Fig. 2
Fig. 2
Kaplan-Meier survival curves of SIAH and EGFR expression in univariate analyses. (A) Tumor expression of ER is associated with increased patient survival with P value of 0.007. (B) Tumor expression of PR is associated with increased patient survival with P value of 0.024. (C) Tumor expression of HER2 is not associated with patient survival. (D) Tumor expression of high SIAH expression (> 30% of tumor cells expressing SIAH) pre-NST is associated with decreased patient survival with P value of 0.046. (E) Tumor expression of high SIAH level (< 30% of tumor cells expressing SIAH) post-NST is associated with decreased patient survival with P value of 0.002. (F) Therapy-induced reduction in SIAH expression post-NST is associated with increased patient survival with P value of 0.001. (G) Tumor expression of high EGFR level (> 1) pre-NST is associated with decreased patient survival with P value of 0.001. (H) Tumor expression of high EGFR level (> 1) post-NST is associated with decreased patient survival with P value of 0.005. (I) Therapy-induced reduction in EGFR expression post-NST is associated with increased survival time with P value of 0.001.
Fig. 3
Fig. 3
SIAH and EGFR expression in node-negative and node-positive breast cancer pre- and post-NST. (A–B) The box-and-whisker plots were used to graphically illustrate the population distribution of SIAH (A) and EGFR (B) expression levels in both node-positive (as marked by purple color bar graphs) and node-negative (as marked by teal color bar graphs) mammary tumors. The SIAH/EGFR expression patterns in the 4 molecular subtypes, Luminal A (Lum A) or Luminal B (Lum B), HER2+ and TNBC, were shown pre- and post-NST treatment. The error bars or whiskers in the histogram and bar charts represent the 95% CI, and in the box plots, they represent the upper (top) and lower quartiles (bottom) data distribution – with points beyond representing outliers. (C–F). Serial micro-sections were cut from each tumor paraffin blocks and the tissue slides were stained with H&E, SIAH, EGFR or Ki67 monoclonal antibody. Representative images of SIAH, EGFR, Ki67 staining in node-negative super-responders (C), node-positive super-responders (D), and node-negative non-responders (E) and node-positive non-responders (F), were shown. SIAH marked proliferating tumor cells, independent of nodal status in breast cancer. Note the lack of SIAH expression in super-responders post-NST correlated with good outcome, whereas persisted SIAH expression post-NST in non-responders correlated with poor survival.
Fig. 4
Fig. 4
Among patients with LN metastases, decreased SIAH expression post-NST and therapy-induced reduction in EGFR expression, are correlated with improved patient survival. Kaplan-Meier analysis was used to generate survival curves to compare survival time among patients with and without LN metastases, whose tumors have high versus low SIAH/EGFR expression pre- and post-NST. Death occurred only in patients with LN metastases: all patients without sentinel LN metastases survived for 7-years, independent of biomarker expression. (A) SIAH expression in treatment-naïve tumors did not correlate with survival. (B) SIAH expression post-NST statistically correlated with survival. (C) Therapy-induced changes in SIAH expression did not correlate with survival. (D) EGFR expression in treatment-naïve tumors did not correlate with survival. (E) EGFR expression post-NST did not correlate with survival. (F) Therapy-induced changes in EGFR statistically correlated with patient survival. Numbers of patients at risk are listed under each K-M curve.
Fig. 5
Fig. 5
Multivariate analyses of six biomarkers, LN metastases, and four clinicopathological predictors in predicting patient survival in breast cancer. (A–C) Area under curve (AUC) plots for the first 5-years based on SIAH, EGFR, Ki67 and/or ER/PR/HER2 expression, alone or in combination, are shown, pre-NST (A), post-NST (B), and NST-induced reduction of these six biomarkers (C). The AUC plots include ER, PR and HER2 in combination (red line), Ki67 (neon green line), EGFR (orange line), SIAH (light teal line), SIAH and EGFR (blue line), SIAH, EGFR and Ki67 in combination (black line). The data showed that SIAH and EGFR, alone or in combination, outperform ER, PR, HER2 and/or Ki67 in predicting patient survival. (D–F) AUC plots for the first 5-years based on SIAH and EGFR, ER/PR/HER2 expression, LN metastases and/or four clinicopathological predictors, alone or in combination, in pre-NST (D), post-NST (E), and NST-induced reduction of these six biomarkers and four clinicopathological predictors (F). The AUC plots include ER, PR and HER2 in combination (red line), 4 clinicopathological predictors (neon green line), LN metastases (blue line), SIAH and EGFR in combination (black line). The data showed that the prognostic values of SIAH and EGFR, alone or in combination, are comparable to the four clinicopathological predictors, in predicting survival. (G–I) The time-dependent survival ROC curves for the first 5 years based on SIAH, EGFR, Ki67 and/or ER/PR/HER2 expression, alone or in combination, are shown, in pre-NST (G), post-NST (H), and NST-induced reduction of these six biomarkers (I) in predicting survival. The survival ROC curves include ER, PR and HER2 in combination (red line), Ki67 (neon green line), EGFR (orange line), SIAH (light teal line), SIAH and EGFR (blue line), SIAH, EGFR and Ki67 in combination (black line). SIAH and EGFR, two RAS pathway biomarkers alone or in combination, outperform ER, PR, HER2 and Ki67 in predicting patient survival. (J–L) Time-dependent survival ROC curves for the first 5-years based on SIAH and EGFR, and/or ER/PR/HER2 in combination with LN metastases, and the four clinicopathological predictors, alone or in combination, are shown, in pre-NST (J), post-NST settings (K), and NST-induced reduction of these six biomarkers (L). The survival ROC curves include ER, PR and HER2 in combination (red line), SIAH and EGFR in combination (black line), LN metastases (blue line), and 4 clinical predictors together (neon green line). The data showed that the prognostic values of SIAH and EGFR, alone or in combination, are comparable to the four clinicopathological predictors, in predicting survival in breast cancer.
Fig. 6
Fig. 6
A schematic illustration of adding two RAS pathway biomarkers, SIAH and EGFR, to evaluate therapy efficacy, tumor response, and predict patient survival in breast cancer. SIAH and/or EGFR expression can be used to monitor tumor responses and identify resistant tumor clones post-NST and stratify patients. SIAH and EGFR outperform ER, PR, HER2 and Ki67 as two robust, sensitive and prognostic biomarkers to predict survival in breast cancer patients with lymph node metastases. The prognostic power of SIAH and EGFR, alone or in combination, is comparable to the clinical gold standards of clinical predictors (LN positivity, mammary tumor size, grade, stage and molecular subtypes in combination), and imaging-guided technology. A marked reduction in SIAH/EGFR expression post-NST would indicate effective therapy and increased survival, while persistent high SIAH/EGFR expression post-NST would indicate ineffective therapy and decreased survival. We found that the reduction of SIAH and/or the changes in EGFR expression post-NST are prognostic in predicting patient survival, especially among partial responders. The therapy-induced changes in SIAH and EGFR expression are highly prognostic in identifying effective/ineffective therapies, differentiating partial responders, identifying resistant tumor clones and predicting remission/relapse in breast cancer patients with lymph node (LN) metastases in neoadjuvant settings. The identification of therapy-responsive and prognostic biomarkers is of paramount importance to stratify patients and guide therapies in clinical oncology and personalized medicine. By developing the two RAS pathway-centered prognostic biomarkers, we hope to identify, personalize, and synergize effective therapies, improve survival for breast cancer patients with metastatic diseases in the future.

References

    1. Adam M.G., Matt S., Christian S., Hess-Stumpp H., Haegebarth A., Hofmann T.G., Algire C. SIAH ubiquitin ligases regulate breast cancer cell migration and invasion independent of the oxygen status. Cell Cycle. 2015;14:3734–3747. - PMC - PubMed
    1. Ahmed A.U., Schmidt R.L., Park C.H., Reed N.R., Hesse S.E., Thomas C.F., Molina J.R., Deschamps C., Yang P., Aubry M.C. Effect of disrupting seven-in-absentia homolog 2 function on lung cancer cell growth. J. Natl. Cancer Inst. 2008;100:1606–1629. - PMC - PubMed
    1. Albain K.S., Barlow W.E., Shak S., Hortobagyi G.N., Livingston R.B., Yeh I.T., Ravdin P., Bugarini R., Baehner F.L., Davidson N.E. Prognostic and predictive value of the 21-gene recurrence score assay in postmenopausal women with node-positive, oestrogen-receptor-positive breast cancer on chemotherapy: a retrospective analysis of a randomised trial. Lancet Oncol. 2010;11:55–65. - PMC - PubMed
    1. Altman D.G., McShane L.M., Sauerbrei W., Taube S.E. Reporting Recommendations for Tumor Marker Prognostic Studies (REMARK): explanation and elaboration. PLoS Med. 2012;9 - PMC - PubMed
    1. Arteaga C.L., Sliwkowski M.X., Osborne C.K., Perez E.A., Puglisi F., Gianni L. Treatment of HER2-positive breast cancer: current status and future perspectives. Nat. Rev. Clin. Oncol. 2012;9:16–32. - PubMed

MeSH terms