

Planar biaxial extension of the lumbar facet capsular ligament reveals significant in-plane shear forces
- PMID: 27569760
- PMCID: PMC5154816
- DOI: 10.1016/j.jmbbm.2016.08.019
Planar biaxial extension of the lumbar facet capsular ligament reveals significant in-plane shear forces
Abstract
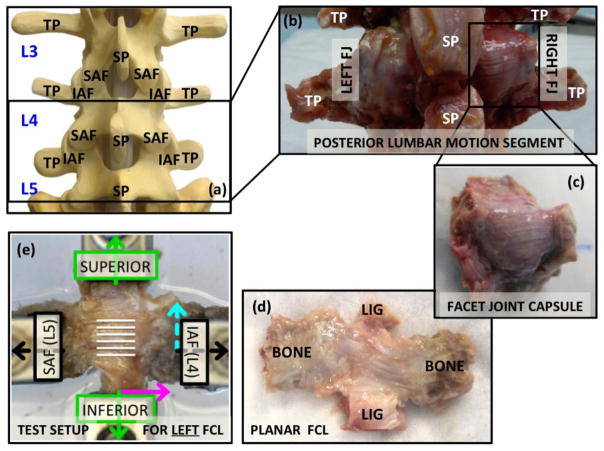
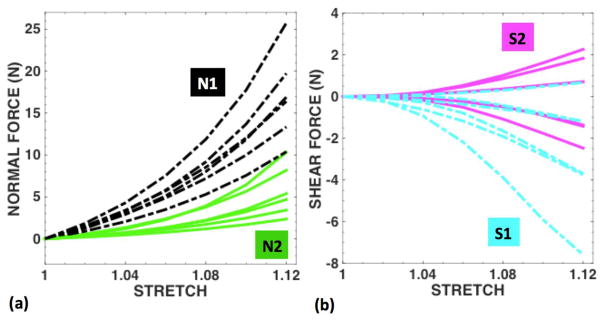
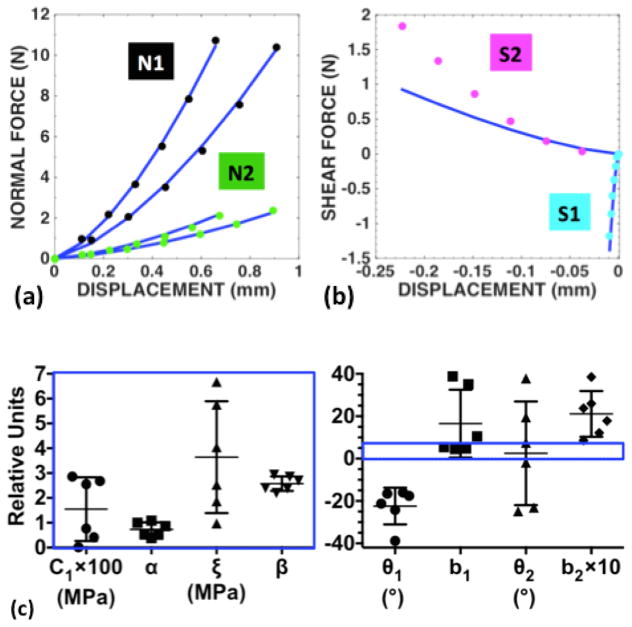
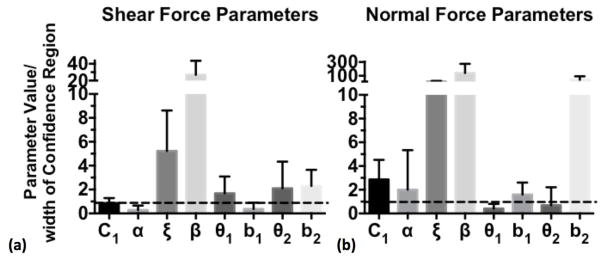
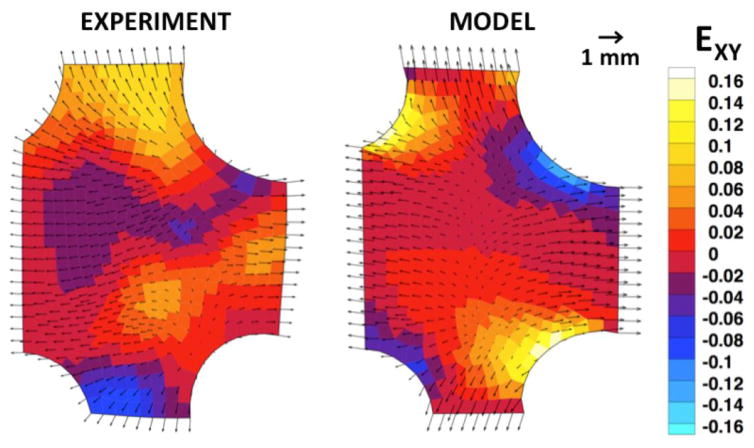
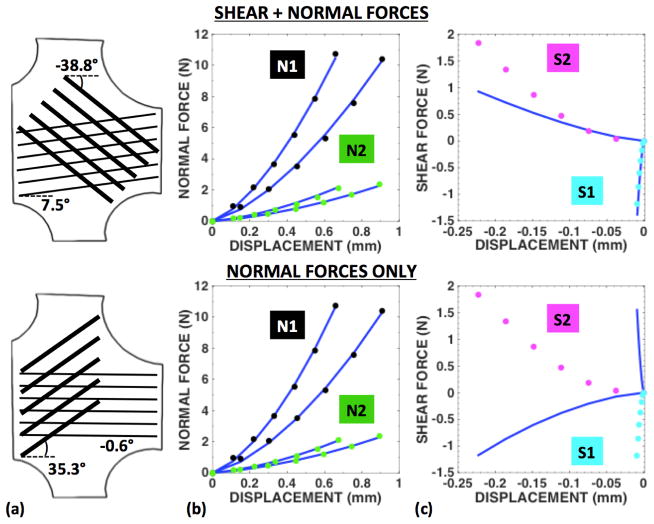
The lumbar facet capsular ligament (FCL) articulates with six degrees of freedom during spinal motions of flexion/extension, lateral bending, and axial rotation. The lumbar FCL is composed of highly aligned collagen fiber bundles on the posterior surface (oriented primarily laterally between the rigid articular facets) and irregularly oriented elastin on the anterior surface. Because the FCL is a capsule, it has multiple insertion sites across the lumbar facet joint, which, along with its material structure, give rise to complicated deformations in vivo. We performed planar equibiaxial mechanical tests on excised healthy cadaveric lumbar FCLs (n=6) to extract normal and shear reaction forces, and fit sample-specific two-fiber-family finite element models to the experimental force data. An eight-parameter anisotropic, hyperelastic model was used. Shear forces at maximum extension (mean values of 1.68N and 3.01N in the two directions) were of comparable magnitude to the normal forces perpendicular to the aligned collagen fiber bundles (4.67N) but smaller than normal forces in the fiber direction (16.11N). Inclusion of the experimental shear forces in the model optimization yielded fits with highly aligned fibers oriented at a specific angle across all samples, typically with one fiber population aligned nearly horizontally and the other at an oblique angle. Conversely, models fit to only the normal force data resulted in a broad range of fiber angles with low specificity. We found that shear forces generated through planar equibiaxial extension aided the model fit in describing the anisotropic nature of the FCL surface.
Copyright © 2016 Elsevier Ltd. All rights reserved.
Figures
Similar articles
-
Computer simulation of lumbar flexion shows shear of the facet capsular ligament.Spine J. 2017 Jan;17(1):109-119. doi: 10.1016/j.spinee.2016.08.014. Epub 2016 Aug 9. Spine J. 2017. PMID: 27520078 Free PMC article.
-
Asymmetric in-plane shear behavior of isolated cadaveric lumbar facet capsular ligaments: Implications for subject specific biomechanical models.J Biomech. 2020 May 22;105:109814. doi: 10.1016/j.jbiomech.2020.109814. Epub 2020 Apr 22. J Biomech. 2020. PMID: 32423548 Free PMC article.
-
Through-thickness regional variation in the mechanical characteristics of the lumbar facet capsular ligament.Biomech Model Mechanobiol. 2021 Aug;20(4):1445-1457. doi: 10.1007/s10237-021-01455-3. Epub 2021 Mar 31. Biomech Model Mechanobiol. 2021. PMID: 33788068 Free PMC article.
-
Experimental measurement of ligament force, facet force, and segment motion in the human lumbar spine.J Biomech. 1993 Apr-May;26(4-5):427-38. doi: 10.1016/0021-9290(93)90006-z. J Biomech. 1993. PMID: 8478347 Review.
-
Shear sensitivity in animal cell culture.Curr Opin Biotechnol. 1993 Apr;4(2):193-6. doi: 10.1016/0958-1669(93)90124-f. Curr Opin Biotechnol. 1993. PMID: 7763569 Review.
Cited by
-
Strong triaxial coupling and anomalous Poisson effect in collagen networks.Proc Natl Acad Sci U S A. 2019 Apr 2;116(14):6790-6799. doi: 10.1073/pnas.1815659116. Epub 2019 Mar 20. Proc Natl Acad Sci U S A. 2019. PMID: 30894480 Free PMC article.
-
Residual Strain and Joint Pressurization Maintain Collagen Tension for On-Joint Lumbar Facet Capsular Ligaments.J Biomech Eng. 2024 Nov 1;146(11):111005. doi: 10.1115/1.4066091. J Biomech Eng. 2024. PMID: 39082759
-
Collagen Organization in Facet Capsular Ligaments Varies With Spinal Region and With Ligament Deformation.J Biomech Eng. 2017 Jul 1;139(7):0710091-9. doi: 10.1115/1.4036019. J Biomech Eng. 2017. PMID: 28241270 Free PMC article.
-
Characterization of the L4/L5 rat facet capsular ligament macromechanical and microstructural responses to tensile failure loading.J Biomech. 2023 Aug;157:111742. doi: 10.1016/j.jbiomech.2023.111742. Epub 2023 Jul 26. J Biomech. 2023. PMID: 37523884 Free PMC article.
-
The role of the facet capsular ligament in providing spinal stability.Comput Methods Biomech Biomed Engin. 2018 Oct;21(13):712-721. doi: 10.1080/10255842.2018.1514392. Comput Methods Biomech Biomed Engin. 2018. PMID: 30719929 Free PMC article.
References
-
- Bonifasi-Lista C, Lake SP, Small MS, Weiss JA. Viscoelastic properties of the human medial collateral ligament under longitudinal, transverse and shear loading. Journal of Orthopaedic Research : Official Publication of the Orthopaedic Research Society. 2005;23:67–76. - PubMed
-
- Boszczyk BM, Boszczyk AA, Korge A, Grillhosl A, Boos WD, Putz R, Milz S, Benjamin M. Immunohistochemical analysis of the extracellular matrix in the posterior capsule of the zygapophysial joints in patients with degenerative L4–5 motion segment instability. Journal of Neurosurgery. 2003;99:27–33. - PubMed
-
- Chandran PL, Barocas VH. Affine versus non-affine fibril kinematics in collagen networks: theoretical studies of network behavior. Journal of Biomechanical Engineering. 2006;128:259–270. - PubMed
MeSH terms
Substances
Grants and funding
LinkOut - more resources
Full Text Sources
Other Literature Sources
