

Effects of whole genome duplication on cell size and gene expression in mouse embryonic stem cells
- PMID: 27569766
- PMCID: PMC5177974
- DOI: 10.1262/jrd.2016-037
Effects of whole genome duplication on cell size and gene expression in mouse embryonic stem cells
Abstract
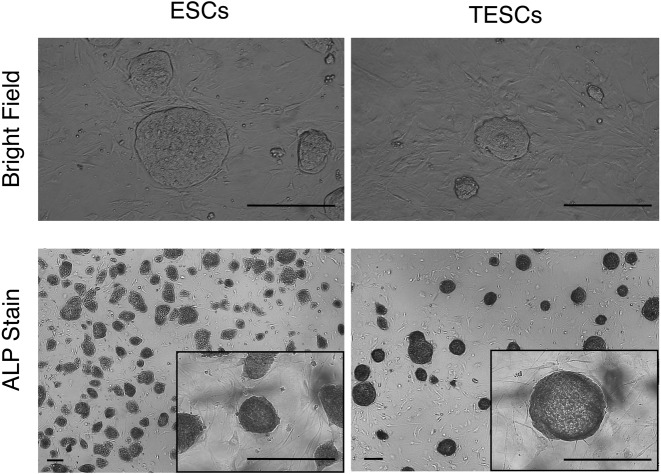
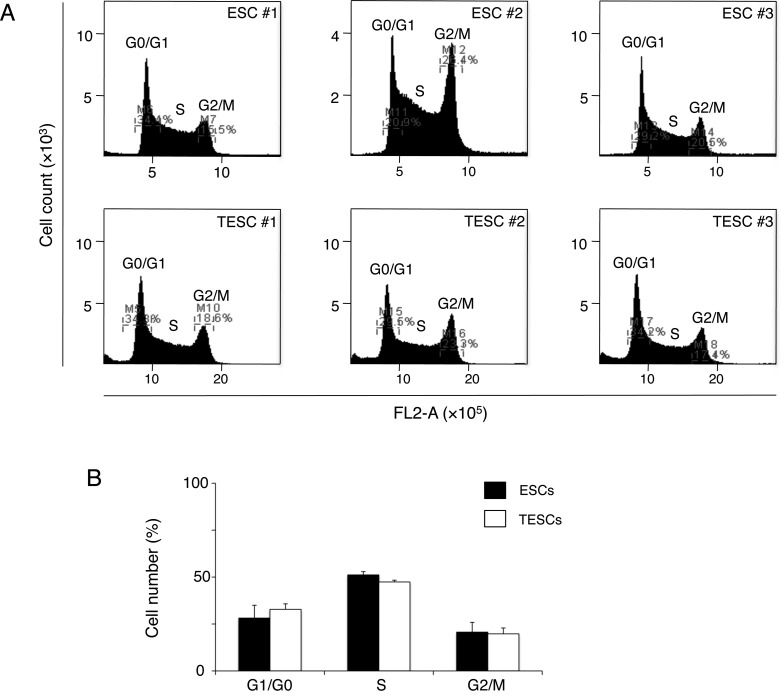
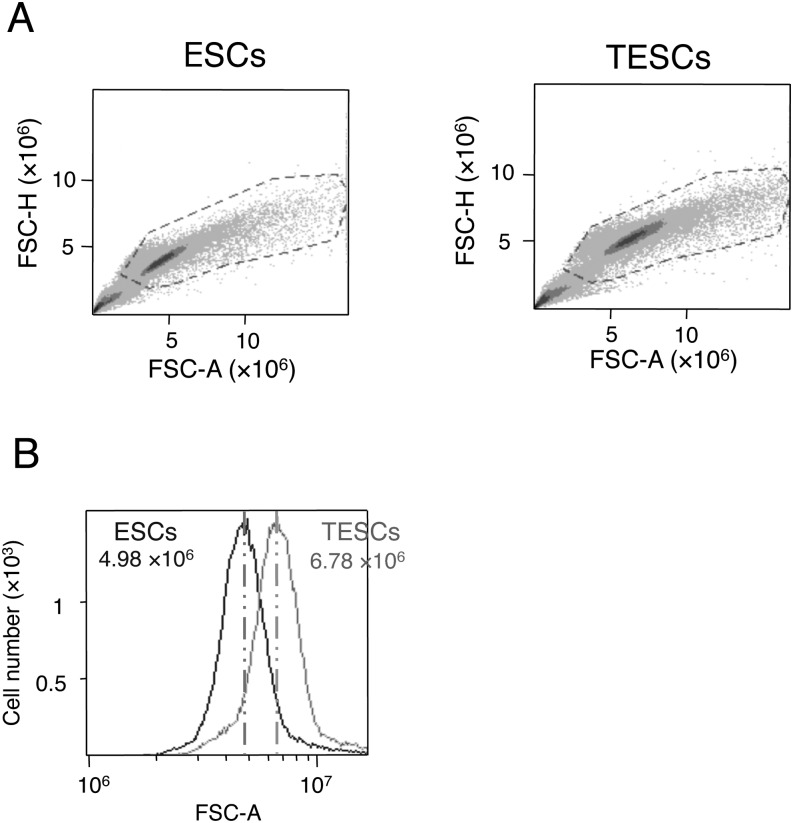
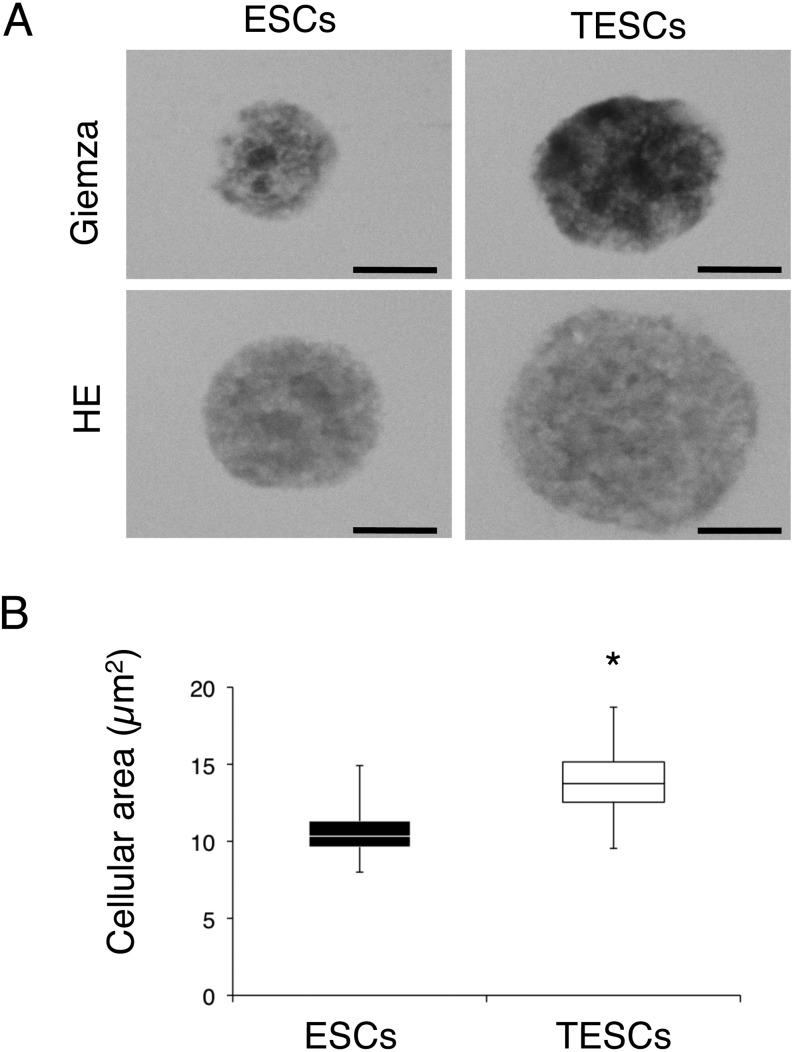
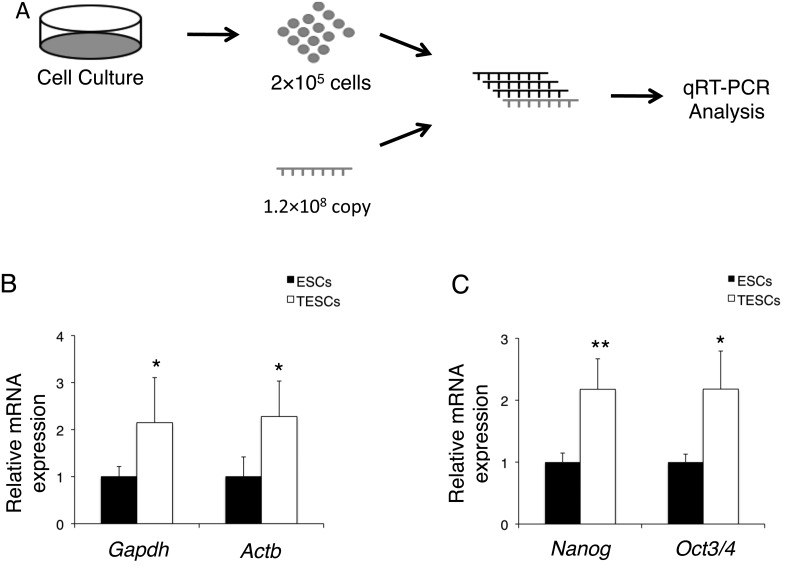
Alterations in ploidy tend to influence cell physiology, which in the long-term, contribute to species adaptation and evolution. Polyploid cells are observed under physiological conditions in the nerve and liver tissues, and in tumorigenic processes. Although tetraploid cells have been studied in mammalian cells, the basic characteristics and alterations caused by whole genome duplication are still poorly understood. The purpose of this study was to acquire basic knowledge about the effect of whole genome duplication on the cell cycle, cell size, and gene expression. Using flow cytometry, we demonstrate that cell cycle subpopulations in mouse tetraploid embryonic stem cells (TESCs) were similar to those in embryonic stem cells (ESCs). We performed smear preparations and flow cytometric analysis to identify cell size alterations. These indicated that the relative cell volume of TESCs was approximately 2.2-2.5 fold that of ESCs. We also investigated the effect of whole genome duplication on the expression of housekeeping and pluripotency marker genes using quantitative real-time PCR with external RNA. We found that the target transcripts were 2.2 times more abundant in TESCs than those in ESCs. This indicated that gene expression and cell volume increased in parallel. Our findings suggest the existence of a homeostatic mechanism controlling the cytoplasmic transcript levels in accordance with genome volume changes caused by whole genome duplication.
Figures
Similar articles
-
Tetraploid Embryonic Stem Cells Maintain Pluripotency and Differentiation Potency into Three Germ Layers.PLoS One. 2015 Jun 19;10(6):e0130585. doi: 10.1371/journal.pone.0130585. eCollection 2015. PLoS One. 2015. PMID: 26091100 Free PMC article.
-
Single-stranded DNA binding protein Ssbp3 induces differentiation of mouse embryonic stem cells into trophoblast-like cells.Stem Cell Res Ther. 2016 May 28;7(1):79. doi: 10.1186/s13287-016-0340-1. Stem Cell Res Ther. 2016. PMID: 27236334 Free PMC article.
-
Mouse embryonic stem cells maintain differentiation potency into somatic lineage despite alternation of ploidy.Zygote. 2022 Aug;30(4):480-486. doi: 10.1017/S0967199421000800. Epub 2022 Mar 31. Zygote. 2022. PMID: 35357291
-
Polyploidy and genome evolution in plants.Curr Opin Genet Dev. 2015 Dec;35:119-25. doi: 10.1016/j.gde.2015.11.003. Epub 2015 Dec 2. Curr Opin Genet Dev. 2015. PMID: 26656231 Review.
-
Natural pathways towards polyploidy in animals: the Squalius alburnoides fish complex as a model system to study genome size and genome reorganization in polyploids.Cytogenet Genome Res. 2013;140(2-4):97-116. doi: 10.1159/000351729. Epub 2013 Jun 18. Cytogenet Genome Res. 2013. PMID: 23796598 Review.
Cited by
-
Paraffin-embedded vertical sections of mouse embryonic stem cells.J Vet Med Sci. 2018 Oct 10;80(10):1479-1481. doi: 10.1292/jvms.18-0352. Epub 2018 Aug 9. J Vet Med Sci. 2018. PMID: 30089742 Free PMC article.
-
Ploidy and Size at Multiple Scales in the Arabidopsis Sepal.Plant Cell. 2018 Oct;30(10):2308-2329. doi: 10.1105/tpc.18.00344. Epub 2018 Aug 24. Plant Cell. 2018. PMID: 30143539 Free PMC article.
References
-
- Ohno S. Evolution by gene duplication. Berlin: Springer-Verlag; 1970.
-
- Panopoulou G, Poustka AJ. Timing and mechanism of ancient vertebrate genome duplications — the adventure of a hypothesis. Trends Genet 2005; 21: 559–567. - PubMed
-
- Kasahara M. The 2R hypothesis: an update. Curr Opin Immunol 2007; 19: 547–552. - PubMed
-
- Brodsky VY, Uryvaeva IV. Genome multiplication in growth and development: biology of polyploid and polytene cells. London: Cambridge University Press; 1985.
MeSH terms
LinkOut - more resources
Full Text Sources
Other Literature Sources