. 2016 Oct 6;19(4):516-529.
doi: 10.1016/j.stem.2016.07.016. Epub 2016 Aug 25.

3D Culture Supports Long-Term Expansion of Mouse and Human Nephrogenic Progenitors

Affiliations

3D Culture Supports Long-Term Expansion of Mouse and Human Nephrogenic Progenitors

Zhongwei Li et al. Cell Stem Cell. .

Abstract

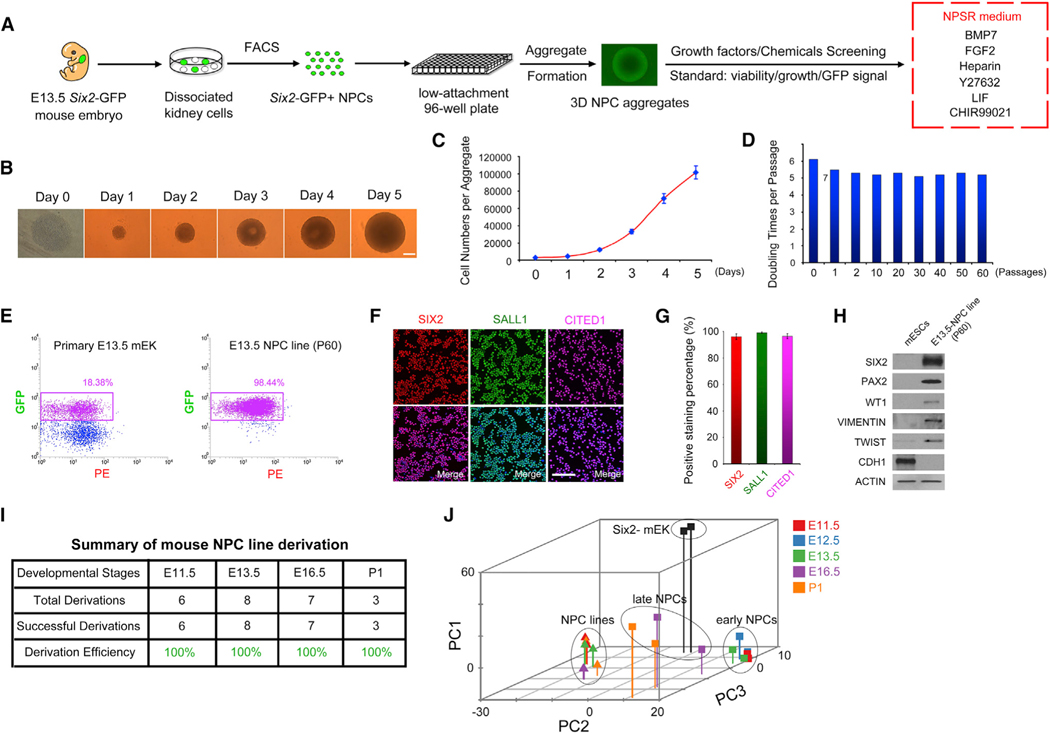
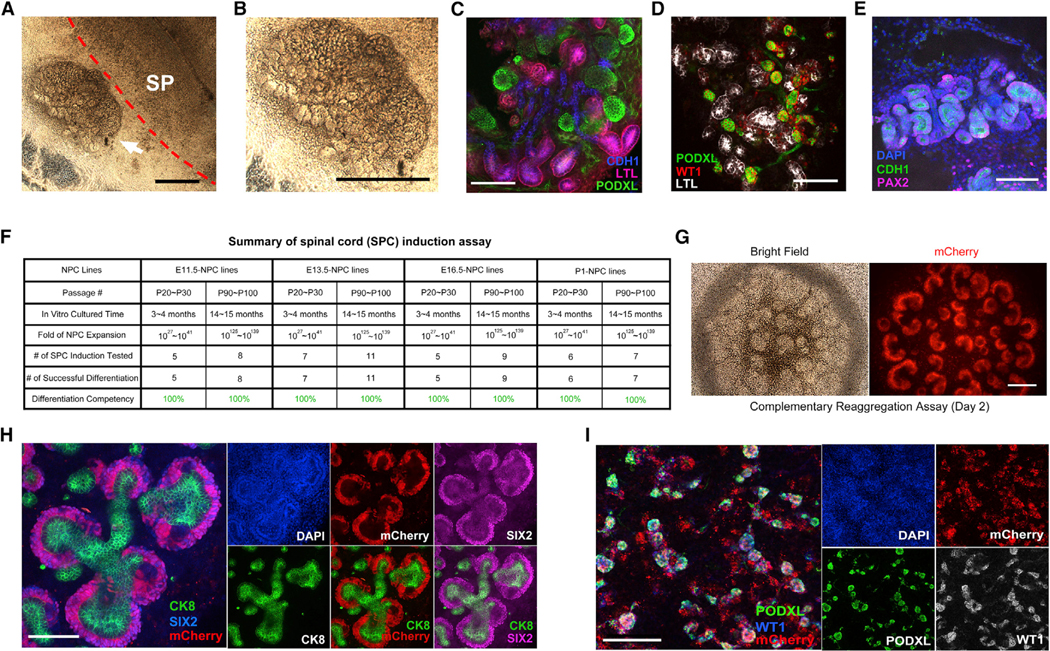
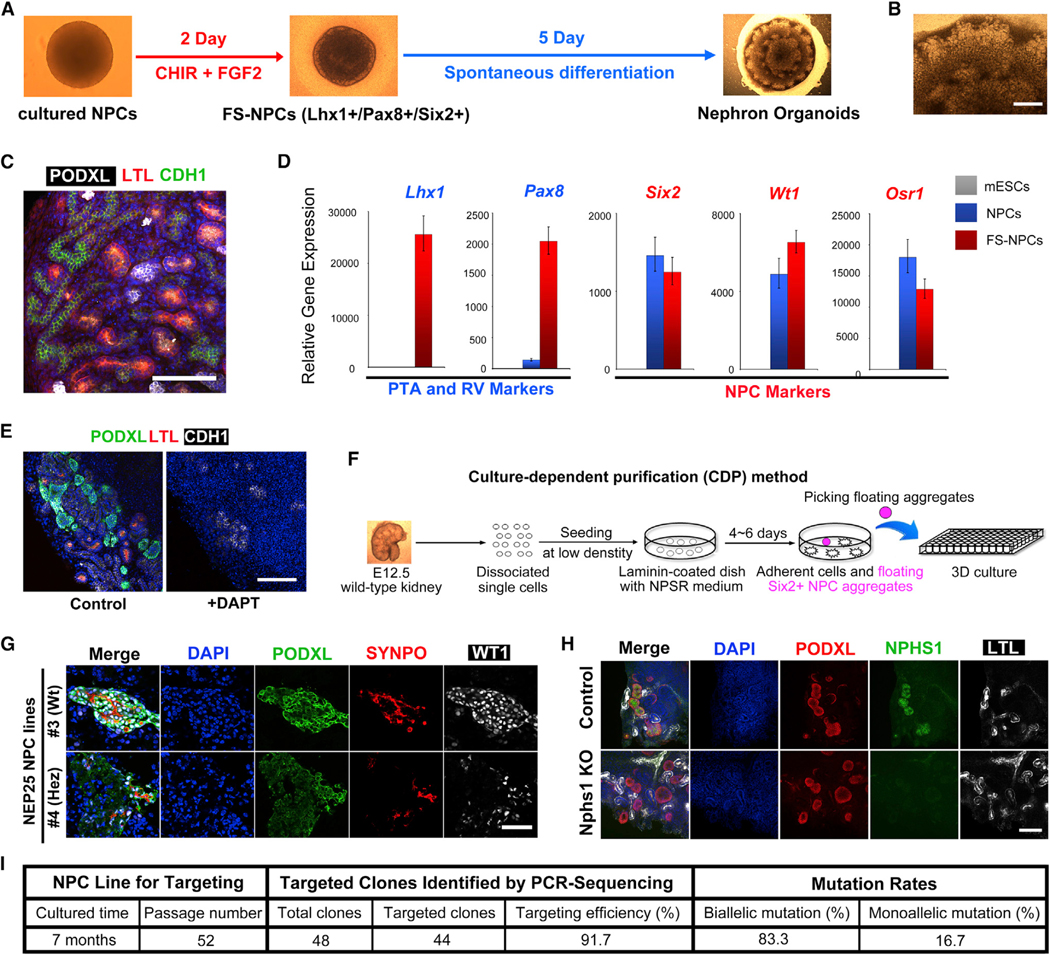
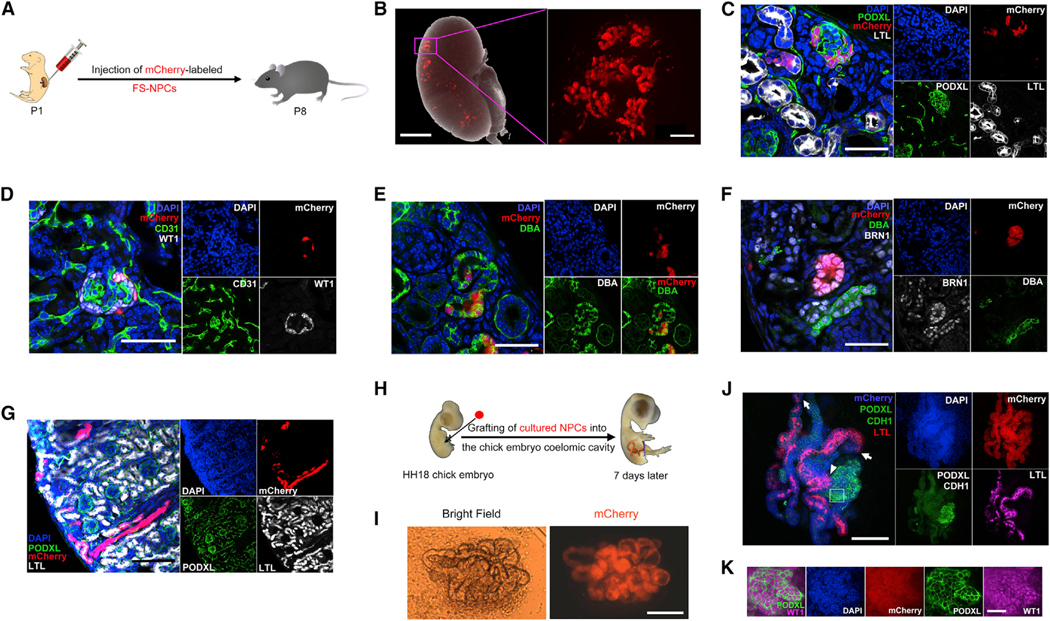
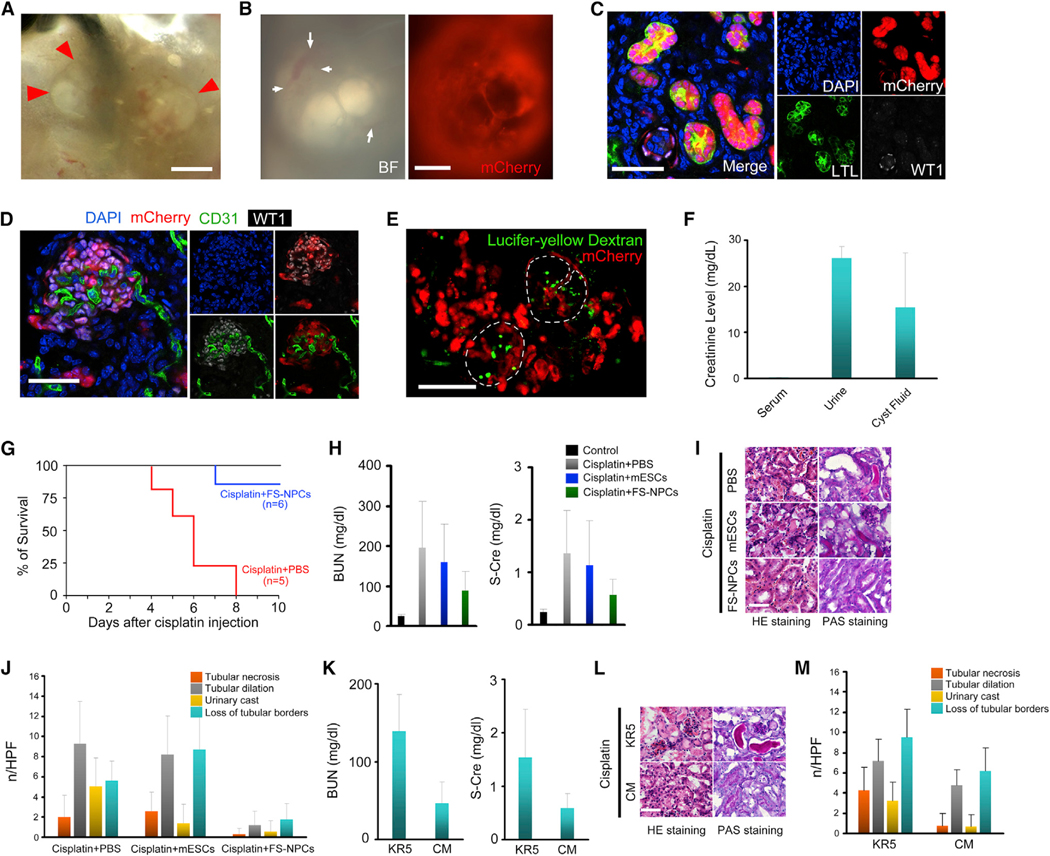
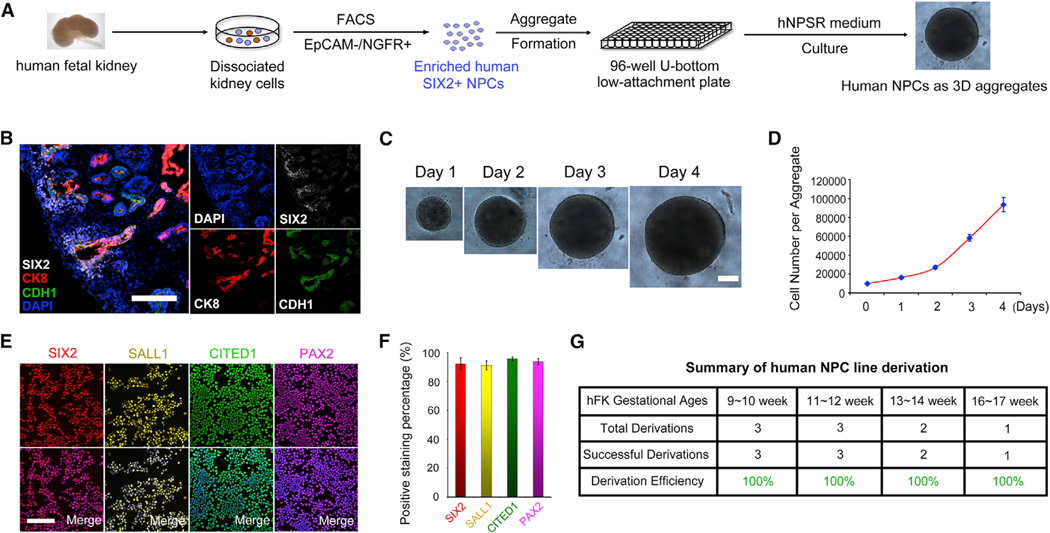
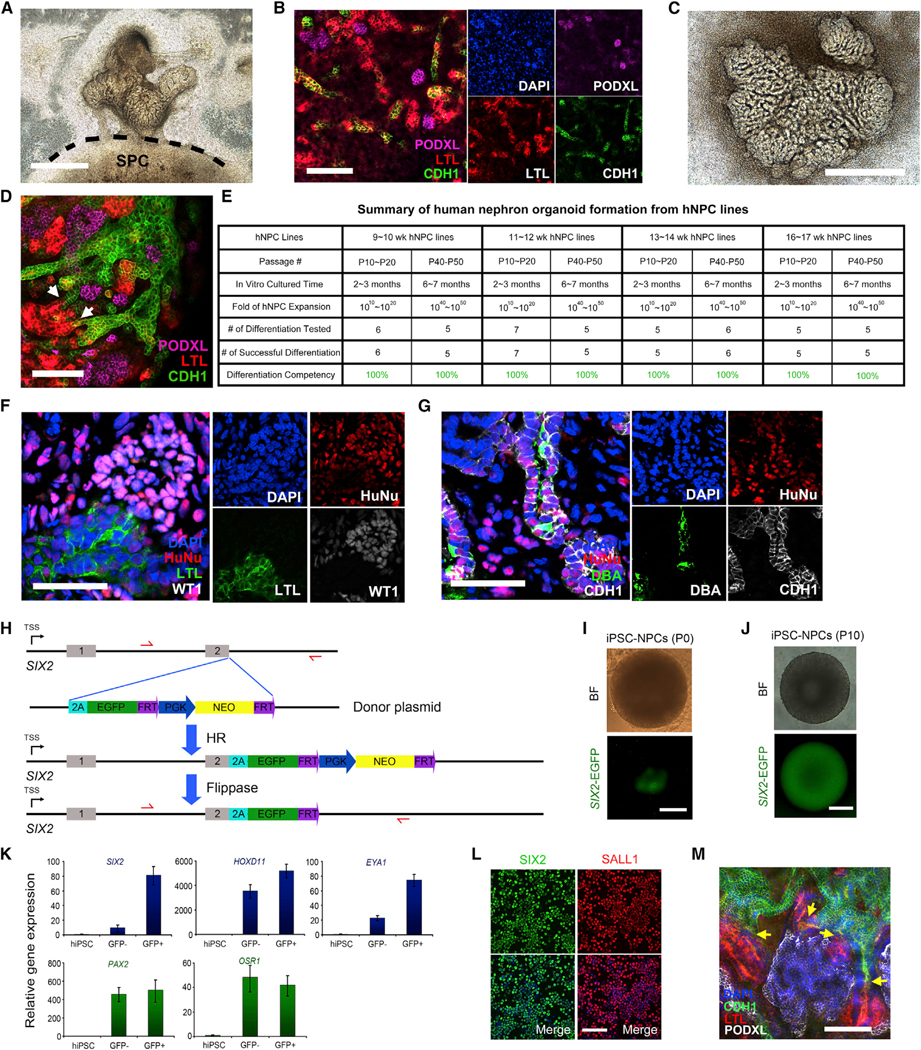
Transit-amplifying nephron progenitor cells (NPCs) generate all of the nephrons of the mammalian kidney during development. Their limited numbers, poor in vitro expansion, and difficult accessibility in humans have slowed basic and translational research into renal development and diseases. Here, we show that with appropriate 3D culture conditions, it is possible to support long-term expansion of primary mouse and human fetal NPCs as well as NPCs derived from human induced pluripotent stem cells (iPSCs). Expanded NPCs maintain genomic stability, molecular homogeneity, and nephrogenic potential in vitro, ex vivo, and in vivo. Cultured NPCs are amenable to gene targeting and can form nephron organoids that engraft in vivo, functionally couple to the host's circulatory system, and produce urine-like metabolites via filtration. Together, these findings provide a technological platform for studying human nephrogenesis, modeling and diagnosing renal diseases, and drug discovery.


Figures

Figure 1.
Figure 1.. NPSR/3D Culture Supports the Derivation and Long-Term Culture of Primary NPCs
(A) Schematic of the experimental protocol. (B) Time-lapse bright-field images showing the morphology and size of NPC aggregates within one passage cycle. Scale bar, 200 μm. (C) Growth curve of NPCs within one passage cycle. (D) Doubling times of NPCs from indicated passages. (E) Flow cytometry analysis of Six2-GFP+ cells from E13.5 mouse fetal kidney (mEK) and E13.5-derived NPCs (P60). (F) Immunofluorescence analysis of NPCs (P60). Scale bar, 100 μm. (G) Quantification of data in (F). Data are presented as mean ± SD. (H) Western blotting analysis in E13.5-derived NPCs (P60). (I) Summary of NPC line derivation efficiency. (J) 3D PCA plot of RNA-seq data. Different colors represent different developmental stages and different shapes indicate primary cells (squares) or cultured NPCs (triangles). Oval circles indicate three distinct clusters: cultured NPCs, early NPCs, and late NPCs. See also Figure S1.
Figure 2.
Figure 2.. Cultured NPCs Retain Nephrogenic Potential In Vitro and Ex Vivo
(A and B) Bright-field images of the spinal cord induction assay. E13.5-derived NPCs (P60) were co-cultured with E12.5 dorsal spinal cord for 7 days. The white arrow indicates the differentiated structures from cultured NPCs (a higher magnification image shown in B). Dashed red line indicates the boundary between spinal cord and differentiated NPCs. SP, spinal cord. Scale bar, 1mm. (C–E) Whole-mount immunofluorescence analyses of E13.5-derived NPCs (P60) induced by dorsal spinal cord for 7 days. Scale bars, 100 μm. (F) Summary of spinal cord induction assay results. (G) Bright field and fluorescence images of reaggregates formed by mCherry-labeled NPCs plus Six2-GFP- cells in air-liquid interface cultured for 2 days. Scale bar, 200 μm. (H) Whole-mount immunofluorescence analyses of the reaggregates showing in G. Scale bar, 100 μm. (I) Whole-mount immunofluorescence analyses of reaggregates formed from mCherry-labeled NPCs plus Six2-GFP cells in air-liquid interface cultured for 7 days. Scale bar, 200 μm. See also Figures S2.
Figure 3.
Figure 3.. Robust and Efficient Nephron Organoid Formation from Cultured NPCs Facilitates Disease Modeling
(A) Schematic of the differentiation from cultured NPCs to nephron organoids through fate-specified NPCs (FS-NPCs). (B) Bright-field image showing part of the nephron organoid. Scale bar, 200 μm. (C) Whole-mount immunofluorescence analyses of the nephron organoid. Scale bar, 100 μm. (D) qRT-PCR analyses in mESCs (control), NPCs, and FS-NPCs. Data are presented as mean ± SD. (E) Immunofluorescence analyses of nephron organoid treated with DAPT from day 2 to day 7. Scale bars, 100 μm. (F) Schematic of the culture-dependent purification (CDP) method. (G) Immunofluorescence analyses of nephron organoids generated from wild-type (#3) and transgenic (#4) NEP25 NPC lines treated with LMB2 (20 nM) for 4 days. Scale bars, 100 μm. (H) Whole-mount immunofluorescence analyses of nephron organoids derived from control wild-type NPCs and Nphs1 knockout NPCs (Nphs1 KO). Scale bar, 50 μm. (I) Efficiencies of CRISPR-Cas9 based gene targeting of nephrin in cultured NPCs. See also Figure S3.
Figure 4.
Figure 4.. In Vivo Developmental Potential of NPCs and FS-NPCs
(A) Schematic of injecting mCherry-labeled mouse FS-NPCs into the kidney of neonatal mice (P1). (B) A merged bright-field and fluorescence image showing the mCherry+ FS-NPCs contribution in a P8 mouse kidney after P1 injection (left), and a higher-magnification fluorescence image (right) (in the right panel, a black box was superimposed over the original software-generated scale bar and, as a replacement, a thicker white scale bar was added). Scale bars represent 1 mm (left) and 100 μm (right). (C–G) Immunofluorescence analyses of P8 mouse kidney 7 days after injection of mCherry-labeled mouse FS-NPCs. Scale bars represent 50 μm (C–F) and 100 μm (G). (H) Schematic of grafting mCherry-labeled mouse NPCs to the coelomic cavity of the HH18 stage chick embryo. (I) Bright field and fluorescence images of dissected out mCherry+ tubular structures from the chick embryo 7 days after grafting. Scale bar, 100 μm. (J) Whole-mount immunostaining of the dissected mCherry+ tubular structure from (I). The white arrows indicate the connecting sites of CDH1+ Henle’s loop/distal tubules and LTL+ proximal tubules. The white arrowhead indicates the connecting site of PODXL+ glomeruli and LTL+ proximal tubules. Scale bar, 100 μm. (K) Higher-magnification immunofluorescence images for PODXL and WT1 in the region indicated by the white box in (J). Scale bars, 25 μm.
Figure 5.
Figure 5.. Cultured NPCs Generate Ectopic Nephron Organoids In Vivo with Urine-like Excretion and Improve Kidney Function in an Acute Kidney Injury Model
(A) Bright-field image showing cystic structures derived from mCherry-labeled NPCs (P60) after 2 weeks of omentum transplantation. Red arrowheads mark the border of the cysts. Scale bar, 500 μm. (B) Bright-field image and fluorescence image of cystic structures. White arrows represent the infiltration of host blood vessels. Scale bar, 500 μm. (C and D) Immunofluorescence analyses of the cystic structures in (B). Scale bars represent 50 μm (C) and 100 μm (D). (E) Lucifer-yellow dextran accumulation in the cyst after 2 hr of tail vein injection. Dashed circles indicate the boundaries of cysts. Scale bar, 500 μm. (F) Creatinine levels in serum, urine, and cyst fluid. Data are presented as mean ± SD. (G) Mouse survival is presented using Kaplan-Meier survival curves. (H) Blood urea nitrogen (BUN) and serum creatinine (S-Cre) levels in cisplatin-induced AKI mice receiving indicated treatments. Data are presented as mean ± SD. (I and J) H&E and PAS staining images (I) and counting of pathological features (J) of histological sections from kidneys in (H). Data are presented as mean ± SD. Scale bars, 50 μm. (K) BUN and S-Cre levels in AKI mice receiving conditioned medium (CM) or unconditioned KR5 medium (DMEM/F12 with 5% knockout serum replacer [KSR]) 4 days after cisplatin administration. Data are presented as mean ± SD. (L and M) H&E and PAS staining images (L) and counting of pathological features (M) of histological sections from kidneys in (K). Data are presented as mean ± SD. Scale bars, 50 μm. See also Figure S4.
Figure 6.
Figure 6.. Derivation and Stable Long-Term Expansion of Human NPCs
(A) Schematic of purification and derivation of human NPC lines from human fetal kidney. (B) Immunofluorescence analyses of an 11-week human fetal kidney section. Scale bars, 100 μm. (C) Bright-field images showing cultured human NPC aggregates within one passage cycle. Scale bars, 200 μm. (D) Growth curve of cultured human NPCs within one passage cycle. (E) Immunofluorescence analyses of cultured human NPCs (P50). Scale bars, 100 μm. (F) Quantification of data in (E). Data presented as mean ± SD. (G) Summary of human NPC line derivation efficiency. See also Figure S5.
Figure 7.
Figure 7.. Cultured Human NPC Lines Maintain Nephrogenic Potential In Vitro and In Vivo
(A) Bright-field image of the spinal cord induction assay. hNPC line (P43) was co-cultured with E12.5 spinal cord for 7 days. Dashed line indicates the boundary between spinal cord and differentiated hNPCs. SPC, spinal cord. Scale bar, 1 mm. (B) Whole-mount immunofluorescence analyses of nephron organoid in (A). Scale bar, 100 μm. (C) Bright-field image of the nephron organoids derived in chemically defined condition (Figure S6A) for 8 days. Scale bar, 1 mm. (D) Whole-mount immunofluorescence analysis of nephron organoid in (C). Scale bar, 100 μm. (E) Summary of human nephron organoid formation efficiency from cultured human NPC lines. (F and G) Immunofluorescence analyses of renal structures derived from human NPCs (P40–P50) (P43) after 3 weeks of omentum transplantation. Scale bars, 50 μm. (H) Schematic of the SIX2-EGFP reporter iPSC line generation. 2A-EGFP-PGK-Neo cassette was inserted downstream of the last exon of endogenous SIX2 gene by transcription activator-like effector nuclease (TALEN)-mediated homologous recombination (HR). Stable single-cell colonies were obtained following neomycin selection. Flippase was then expressed in these single-cell clones via transient transfection to excise the FRT-flanked PGK-Neo cassette. (I) Bright-field (BF) and fluorescence images show that after differentiation (P0), clusters of SIX2-EGFP+ cells were formed from SIX2-EGFP knockin reporter hiPSC line. Scale bar, 200 μm. (J) Bright-field (BF) and fluorescence images show that after ten passages of cultured hiPSC-NPCs in the hNPSR/3D condition (~2 months), the SIX2-EGFP signal was maintained. Scale bar, 200 μm. (K) qRT-PCR analyses in undifferentiated hiPSCs (control), SIX2-EGFP–, and SIX2-EGFP+ cells after differentiation (P0). Data are presented as mean ± SD. (L) Cytospin immunostaining in cultured hiPSC-NPCs (P10). Scale bar, 100 μm. (M) Whole-mount immunofluorescence analysis of nephron organoids derived from cultured hiPSC-NPCs (P10). The yellow arrows indicate the connecting sites of CDH1+ Henle’s loop/distal tubule and LTL+ proximal tubule. Scale bar, 100 μm. See also Figure S6.

References

    1. Araoka T, Mae S, Kurose Y, Uesugi M, Ohta A, Yamanaka S, and Osafune K. (2014). Efficient and rapid induction of human iPSCs/ESCs into nephrogenic intermediate mesoderm using small molecule-based differentiation methods. PLoS ONE 9, e84881. - PMC - PubMed
    1. Barak H, Huh SH, Chen S, Jeanpierre C, Martinovic J, Parisot M, Bole-Feysot C, Nitschke P, Salomon R, Antignac C, et al. (2012). FGF9 and FGF20 maintain the stemness of nephron progenitors in mice and man. Dev. Cell 22, 1191–1207. - PMC - PubMed
    1. Barasch J, Yang J, Ware CB, Taga T, Yoshida K, Erdjument-Bromage H, Tempst P, Parravicini E, Malach S, Aranoff T, and Oliver JA (1999). Mesenchymal to epithelial conversion in rat metanephros is induced by LIF. Cell 99, 377–386. - PubMed
    1. Brown AC, Muthukrishnan SD, and Oxburgh L. (2015). A synthetic niche for nephron progenitor cells. Dev. Cell 34, 229–241. - PMC - PubMed
    1. Carroll TJ, Park JS, Hayashi S, Majumdar A, and McMahon AP (2005). Wnt9b plays a central role in the regulation of mesenchymal to epithelial transitions underlying organogenesis of the mammalian urogenital system. Dev. Cell 9, 283–292. - PubMed

Publication types