. 2016 Dec 1;19(6):784-799.
doi: 10.1016/j.stem.2016.08.004. Epub 2016 Aug 25.

MED12 Regulates HSC-Specific Enhancers Independently of Mediator Kinase Activity to Control Hematopoiesis

Affiliations

MED12 Regulates HSC-Specific Enhancers Independently of Mediator Kinase Activity to Control Hematopoiesis

Beatriz Aranda-Orgilles et al. Cell Stem Cell. .

Abstract

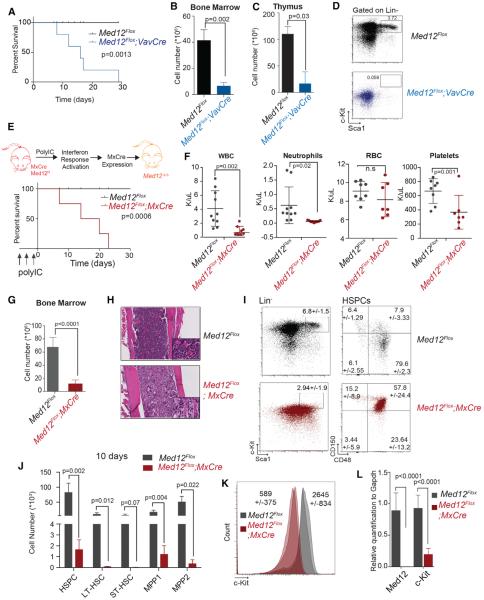
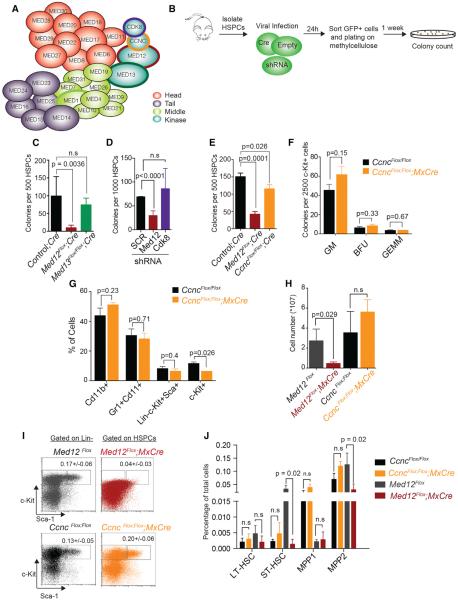
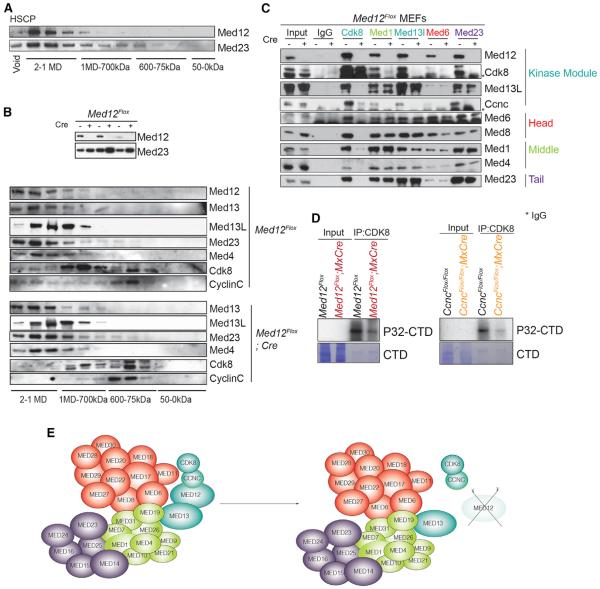
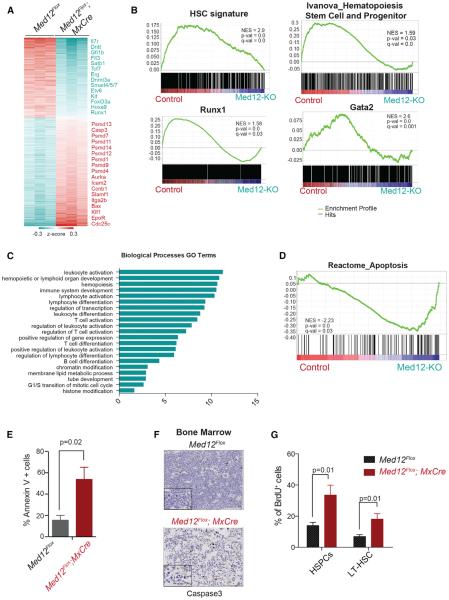
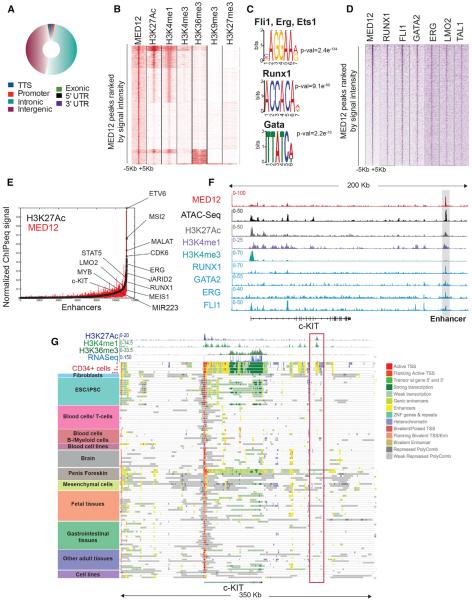
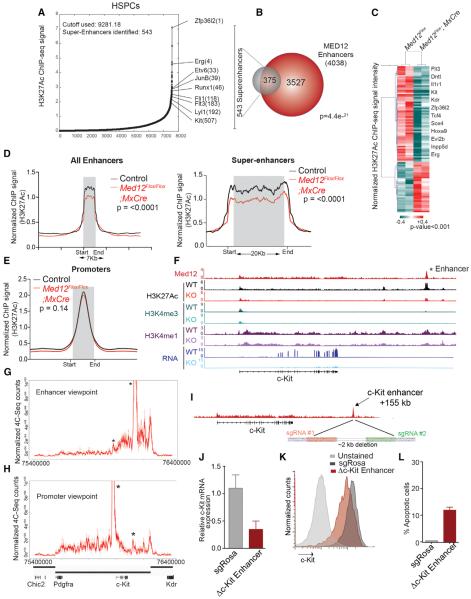
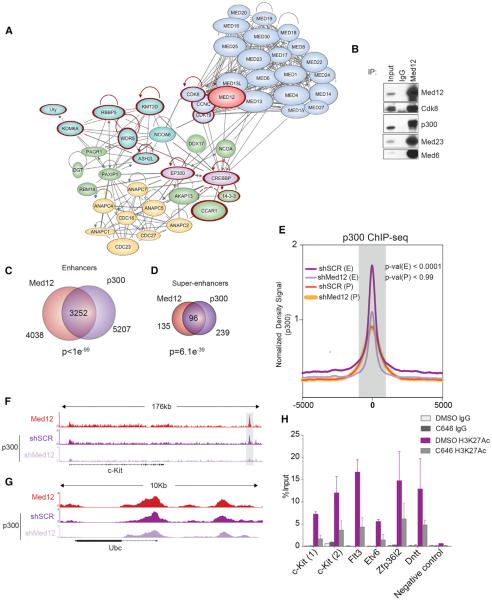
Hematopoietic-specific transcription factors require coactivators to communicate with the general transcription machinery and establish transcriptional programs that maintain hematopoietic stem cell (HSC) self-renewal, promote differentiation, and prevent malignant transformation. Mediator is a large coactivator complex that bridges enhancer-localized transcription factors with promoters, but little is known about Mediator function in adult stem cell self-renewal and differentiation. We show that MED12, a member of the Mediator kinase module, is an essential regulator of HSC homeostasis, as in vivo deletion of Med12 causes rapid bone marrow aplasia leading to acute lethality. Deleting other members of the Mediator kinase module does not affect HSC function, suggesting kinase-independent roles of MED12. MED12 deletion destabilizes P300 binding at lineage-specific enhancers, resulting in H3K27Ac depletion, enhancer de-activation, and consequent loss of HSC stemness signatures. As MED12 mutations have been described recently in blood malignancies, alterations in MED12-dependent enhancer regulation may control both physiological and malignant hematopoiesis.


Figures

Figure 1
Figure 1. MED12 Deletion Leads to Bone Marrow Failure and Rapid Animal Lethality
(A) Kaplan-Meier curve plotting survival of Med12Flox;Vav-Cre and control mice (n = 8) is shown. (B and C) Total cell counts in bone marrow (B) and thymus (C) of Med12Flox;Vav-Cre and control animals (n = 3) 1 week after birth are shown. (D) Representative immunophenotypic analysis of bone marrow of the indicated mice (n = 3) is shown. (E) Kaplan-Meier curve plotting survival of Med12Flox;Mx-Cre and Med12Flox animals (n = 4) is shown. (F) Peripheral blood counts of Med12Flox;Mx-Cre and controls 10 days after first pI:pC injection (n = 8–10) are shown. (G) Bone marrow counts (femura, tibia, and hip) of Med12Flox;Mx-Cre animals and Med12Flox 10 days after pI:pC injection are shown. (H) H&E staining of bone sections is shown. (I) Immunophenotypic of HSPCs of indicated mice 4 days after second pI:pC injection (n = 4) is shown. (J) Absolute numbers of HSC populations are shown (HSPCs: Lin, Sca-1+, and c-Kit+; LT-HSC: CD150+ and CD48; ST-HSC: CD150 and CD48; MPP1: CD150+ and CD48+; and MPP2: CD150 and CD48+). (K) Mean geometric frequency of c-KIT surface marker 4 days after second pI:pC injection (n = 4) (p < 0.0005) is shown. (L) Expression of Med12 and c-Kit in HSPCs 4 days after two pI:pC injections (n = 4). Error bars represent mean ± SD; p values were determined with two-tailed Student's t tests. See also Figures S1 and S2.
Figure 2
Figure 2. Kinase Module-Independent Activity of Med12 in the Hematopoietic System
(A) Schematic of the Mediator complex is shown. (B) Methylcellulose CFU assay strategy is shown. (C) CFU assay with HSPCs from control, Med13Flox/Flox, and Med12Flox mice infected with Cre virus is shown. (D) CFU assay in wild-type mouse HSPCs infected with indicated shRNAs is shown. (E) CFU assay using HSPCs from controls, CcncFlox/Flox, and Med12Flox mice transduced with Cre virus is shown. (F) CFU assay with c-Kit+-enriched cells from CcncFlox/Flox and CcncFlox/Flox;MxCre mice 10 days after pI:pC injection is shown. (G) FACS surface marker analysis of colonies from (F) is shown. (H) Total bone marrow cellularity of indicated mice is shown. (I) Immunophenotypic analysis of control, CncFlox/Flox;MxCre (10 days after pI:pC), and Med12Flox;MxCre (4 days after pI:pC) is shown. (J) Frequencies of HSPC populations in indicated mice. Data represent mean ± SD (n = 3; p values were determined with two-tailed Student's t tests). See also Figure S3.
Figure 3
Figure 3. MED12 Loss Leads to Dissociation of CYCLIN C/CDK8 without Affecting the Core Mediator Complex
(A) Western blot of MED12 and MED23 after Superose 6 size exclusion chromatography on HPC-7 nuclear cell extracts is shown. (B) Western blot of indicated members of the Mediator complex components after Superose 6 size exclusion chromatography on nuclear extracts of control or MED12-deficient MEFs. Upper part shows MED12 deletion in the first eluted fractions. (C) IP was performed with indicated Mediator members. (D) IP kinase experiments with the indicated mice are shown. (E) Schema depicting lack of CYCLIN C/CDK8 binding to Mediator core after MED12 deletion. See also Figure S3.
Figure 4
Figure 4. MED12 Deletion Causes Loss of HSC Signatures and Increased Rates of Apoptosis
(A) Differentially expressed genes (fold change >1.5, false discovery rate [FDR] p value < 0.05) between Med12Flox;Mx-Cre and Med12Flox HSPCs 4 days after pI:pC are shown. (B) HSC and key hematopoietic transcription factor gene signatures are decreased upon MED12 deletion, as determined by GSEA. (C) Biological function annotation of downregulated genes in MED12-deficient HSPCs, using The Database for Annotation, Visualization and Integrated Discovery (DAVID) (Huang da et al., 2009), is shown. (D) Representative apoptosis signature identified by GSEA enriched in MED12-deficient cells is shown. (E) Annexin V staining in indicated mice 4 days after pI:pC is shown. (F) Cleaved caspase-3 immunohistochemistry in bone marrow of Med12Flox;Mx-Cre and Med12Flox mice 10 days after pI:pC. Lower panel shows higher magnification. (G) In vivo BrdU+ labeling of LT-HSCs (Lineage−, c-Kit+, Sca-1+, CD150+, and CD48−) and HSPCs (Lineage, c-Kit+, and Sca-1+) is shown. Scale bars, 100 and 10 μm. Data represent mean ± SD; p values were determined with two-tailed Student's t tests. See also Figure S4 and Table S5.
Figure 5
Figure 5. MED12 Colocalizes with Essential Transcription Factors at HSPC-Specific Active Enhancers
(A) Genomic distribution of MED12-occupied regions in human CD34+ cells is shown. (B) Heatmap displays MED12 ChIP-seq data and indicated histone marks clustered by k-means, all arranged by MED12 signal density. (C) Representative transcription factor-binding motifs enriched at MED12-bound regions are shown. (D) Heatmap shows MED12 ChIP-seq data and transcription factors sorted by MED12 peaks. (E) Distribution of H3K27Ac and MED12 ChIP-seq density across enhancers and super-enhancers in human CD34+ cells is shown. (F) Track image shows the indicated ChIP-seq and assay for transposase-accessible chromatin with high throughput sequencing (ATAC-seq) experiments on the c-KIT locus. (G) Gene track image shows ChromHMM states at c-KIT locus in all tissues available from Roadmap Epigenomics project (http://www.roadmapepigenomics.org/). *mobilized CD34+; **cultured CD34+ cells; ***primary CD34+ cells. See also Figure S5 and Tables S1 and S2.
Figure 6
Figure 6. MED12 Is Required to Maintain Enhancer Activity In Vivo
(A) H3K27Ac ChIP-seq density across enhancers and super-enhancers in mouse HSPCs is shown. (B) Overlap between super-enhancers in mouse-isolated HSPCs and MED12-bound enhancers identified in HPC-7. MED12 ChIP-seq was performed in HPC-7 cells due to the requirement of a large number of cells. Some super-enhancers contain more than one MED12 enhancer. (C) Super-enhancer regions showing significant changes in H3K27Ac density after Med12 deletion. Some relevant hematopoietic genes with an associated super-enhancer are indicated. Average of experiments of iChIP HSPCs from four independent Med12Flox and Med12Flox;Mx-Cre mice is shown. Analysis was done with DiffBind, which calculates the p value with the Wald test. (D) ChIP-seq density profile representing H3K27Ac signal at enhancer and super-enhancers is shown. (E) ChIP-seq density profile showing H3K27Ac signal at promoters. The p values were calculated with the Mann-Whitney U test for (D) and (E). (F) Track image of the indicated ChIP-seq binding profiles at the c-Kit locus Med12Flox;Mx-Cre and Med12Flox mice 4 days after pI:pC injection. MED12 ChIP-seq was done on HPC-7 and histone marks were profiled in mouse-derived HSPCs. (G and H) High-resolution 4C-seq performed with c-Kit promoter and enhancer baits in HPC-7 cells. Black bars indicate TADs (Dixon et al., 2012). Full lines represent the mean of replicates and dashed lines represent the signal for each replicate. Asterisks show the tested areas. (I) Schematics show c-Kit enhancer region deleted. (J) c-Kit mRNA levels upon enhancer deletion are shown. (K) c-KIT surface levels marker upon enhancer deletion is shown. (L) Annexin V staining upon c-KIT enhancer deletion. Error bars represent mean ± SD; p values were determined with two-tailed Student's t tests. See also Figure S6 and Table S3.
Figure 7
Figure 7. MED12 Interacts with P300 and Promotes Its Binding to the Chromatin on Hematopoietic Enhancers
(A) MED12 interaction partners network in HPC-7 cells. Proteins with mutations in hematological diseases are highlighted in red. (B) MED12 IP in HPC-7 confirming interaction with P300. A repetition of this experiment is shown in Figure S7B. (C) Overlap of MED12-associated and P300-associated enhancer regions is shown. (D) Overlap of MED12-associated and P300-associated super-enhancer regions is shown. (E) Normalized P300 ChIP-seq signal profiles of P300-MED12 overlapping enhancers centered on distal P300 and promoters. The p values were calculated with the Mann-Whitney U test. (F) ChIP-seq track of p300 and MED12 on c-Kit enhancer locus is shown. (G) ChIP-seq track of P300 and MED12 on Ubc locus is shown. (H) ChIP-qPCR analysis of H3K27Ac at the indicated enhancers in mouse-isolated HSPCs following a 2-hr treatment with DMSO or with 10 μM C646 nM. Error bars represent mean ± SD. See also Figure S7, Table S1, and Table S4.

Comment in

Similar articles

Cited by

References

    1. Akoulitchev S, Chuikov S, Reinberg D. TFIIH is negatively regulated by cdk8-containing mediator complexes. Nature. 2000;407:102–106. - PubMed
    1. Allen BL, Taatjes DJ. The Mediator complex: a central integrator of transcription. Nat. Rev. Mol. Cell Biol. 2015;16:155–166. - PMC - PubMed
    1. Beck D, Thoms JA, Perera D, Schütte J, Unnikrishnan A, Knezevic K, Kinston SJ, Wilson NK, O'Brien TA, Göttgens B, et al. Genome-wide analysis of transcriptional regulators in human HSPCs reveals a densely interconnected network of coding and noncoding genes. Blood. 2013;122:e12–e22. - PubMed
    1. Borggrefe T, Yue X. Interactions between subunits of the Mediator complex with gene-specific transcription factors. Semin. Cell Dev. Biol. 2011;22:759–768. - PubMed
    1. Bourbon HM. Comparative genomics supports a deep evolutionary origin for the large, four-module transcriptional mediator complex. Nucleic Acids Res. 2008;36:3993–4008. - PMC - PubMed

Publication types