

Growth in stratospheric chlorine from short-lived chemicals not controlled by the Montreal Protocol
- PMID: 27570318
- PMCID: PMC4981078
- DOI: 10.1002/2015GL063783
Growth in stratospheric chlorine from short-lived chemicals not controlled by the Montreal Protocol
Abstract
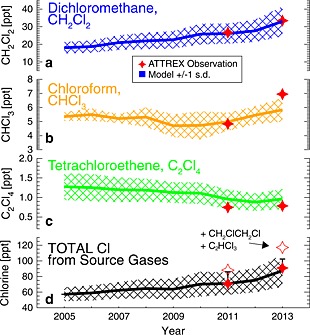
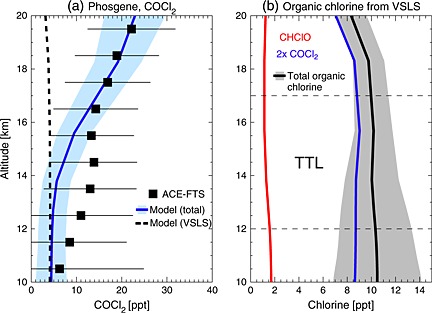
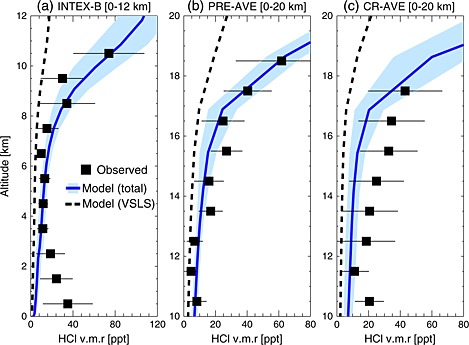
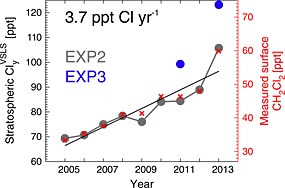
We have developed a chemical mechanism describing the tropospheric degradation of chlorine containing very short-lived substances (VSLS). The scheme was included in a global atmospheric model and used to quantify the stratospheric injection of chlorine from anthropogenic VSLS ( ClyVSLS) between 2005 and 2013. By constraining the model with surface measurements of chloroform (CHCl3), dichloromethane (CH2Cl2), tetrachloroethene (C2Cl4), trichloroethene (C2HCl3), and 1,2-dichloroethane (CH2ClCH2Cl), we infer a 2013 ClyVSLS mixing ratio of 123 parts per trillion (ppt). Stratospheric injection of source gases dominates this supply, accounting for ∼83% of the total. The remainder comes from VSLS-derived organic products, phosgene (COCl2, 7%) and formyl chloride (CHClO, 2%), and also hydrogen chloride (HCl, 8%). Stratospheric ClyVSLS increased by ∼52% between 2005 and 2013, with a mean growth rate of 3.7 ppt Cl/yr. This increase is due to recent and ongoing growth in anthropogenic CH2Cl2-the most abundant chlorinated VSLS not controlled by the Montreal Protocol.
Keywords: Montreal Protocol; VSLS; dichloromethane; ozone; phosgene; stratosphere.
Figures
References
-
- Breider, T. J. , Chipperfield M. P., Richards N. A. D., Carslaw K. S., Mann G. W., and Spracklen D. V. (2010), Impact of BrO on dimethylsulfide in the remote marine boundary layer, Geophys. Res. Lett., 37, L02807, doi: 10.1029/2009GL040868. - DOI
-
- Brown, A. T. , Chipperfield M. P., Boone C., Wilson C., Walker K. A., and Bernath P. F. (2011), Trends in atmospheric halogen containing gases since 2004, J. Quant. Spectrosc. Radiat. Transfer, 112(16), 2552–2566, doi: 10.1016/j.jqsrt.2011.07.005. - DOI
-
- Campbell, N. , et al. (2005), HFCs and PFCs: Current and future supply, demand and emissions, plus emissions of CFCs, HCFCs and halons, in Safeguarding the Ozone Layer and the Global Climate System, Issues Related to Hydrofluorocarbons and Perfluorocarbons, IPCC/TEAP Special Report, chap. 11, pp. 404–436, Cambridge, Univ. Press, Cambridge, U. K.
-
- Carpenter, L. , Reimann S., Burkholder J. B., Clerbaux C., Hall B. D., Hossaini R., Laube J. C., and Yvon‐Lewis S. A. (2014), Ozone‐depleting substances (ODSs) and other gases of interest to the Montreal Protocol, in Scientific Assessment of Ozone Depletion: 2014, Global Ozone Research and Monitoring Project ‐ Report No. 55, edited by Engel A. and Montzka S. A., chap. 1, pp. 1–101, World Meteorol. Organ., Geneva, Switzerland.
-
- Chipperfield, M. P. (2006), New version of the TOMCAT/SLIMCAT off‐line chemical transport model: Intercomparison of stratospheric tracer experiments, Q. J. R. Meteorol. Soc., 132, 1179–1203, doi: 10.1256/qj.05.51. - DOI
LinkOut - more resources
Full Text Sources