

Percutaneous Double Lumen Cannula for Right Ventricle Assist Device System: A Computational Fluid Dynamics Study
- PMID: 27570334
- PMCID: PMC4998840
- DOI: 10.1016/j.bbe.2016.04.002
Percutaneous Double Lumen Cannula for Right Ventricle Assist Device System: A Computational Fluid Dynamics Study
Abstract
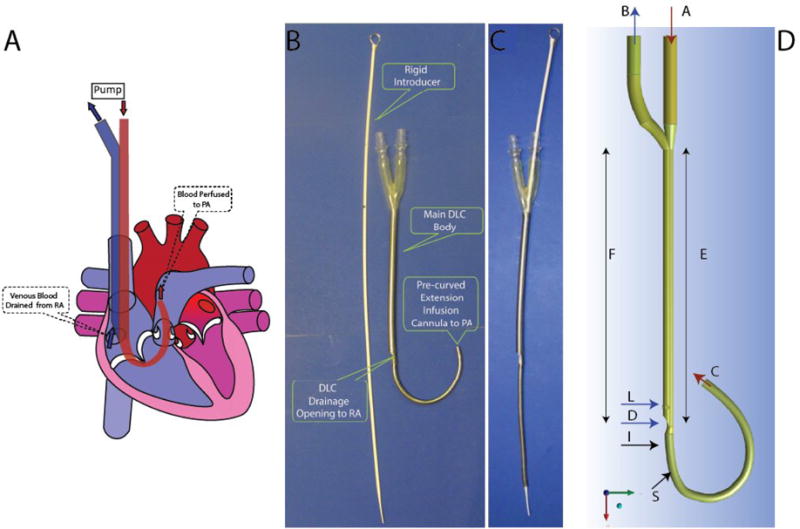
Objectives: Our goal is to develop a double lumen cannula (DLC) for a percutaneous right ventricular assist device (pRVAD) in order to eliminate two open chest surgeries for RVAD installation and removal. The objective of this study was to evaluate the performance, flow pattern, blood hemolysis, and thrombosis potential of the pRVAD DLC.
Methods: Computational fluid dynamics (CFD), using the finite volume method, was performed on the pRVAD DLC. For Reynolds numbers <4000, the laminar model was used to describe the blood flow behavior, while shear-stress transport k-ω model was used for Reynolds numbers >4000. Bench testing with a 27 Fr prototype was performed to validate the CFD calculations.
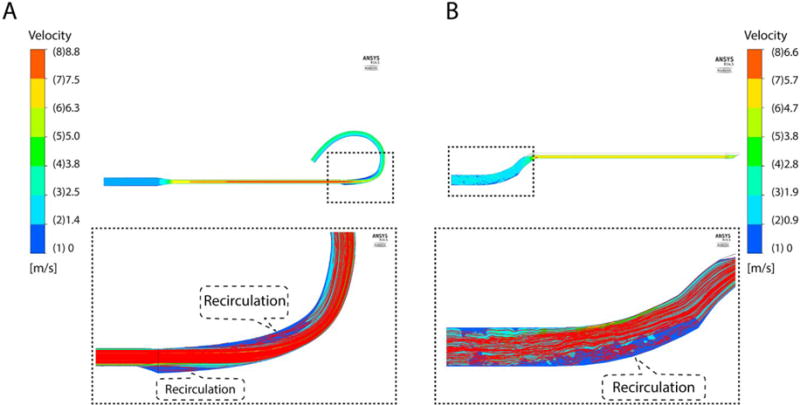
Results: There was <1.3% difference between the CFD and experimental pressure drop results. The Lagrangian approach revealed a low index of hemolysis (0.012% in drainage lumen and 0.0073% in infusion lumen) at 5 l/min flow rate. Blood stagnancy and recirculation regions were found in the CFD analysis, indicating a potential risk for thrombosis.
Conclusions: The pRVAD DLC can handle up to 5 l/min flow with limited potential hemolysis. Further modification of the pRVAD DLC is needed to address blood stagnancy and recirculation.
Keywords: computational fluid dynamics; double lumen cannula; heart failure; percutaneous; ventricular assist device.
Figures


Similar articles
-
Development of a Double-Lumen Cannula for a Percutaneous RVAD.ASAIO J. 2015 Jul-Aug;61(4):397-402. doi: 10.1097/MAT.0000000000000227. ASAIO J. 2015. PMID: 25851314 Free PMC article.
-
Hemodynamic evaluation of a novel double lumen cannula for left ventricle assist device system.Technol Health Care. 2025 Mar;33(2):814-830. doi: 10.1177/09287329241290947. Epub 2024 Nov 6. Technol Health Care. 2025. PMID: 39973849
-
Numerical and experimental flow analysis of the Wang-Zwische double-lumen cannula.ASAIO J. 2011 Jul-Aug;57(4):318-27. doi: 10.1097/MAT.0b013e31821c08bc. ASAIO J. 2011. PMID: 21654494
-
A transapical-to-aorta double lumen cannula-based neonate left ventricular assist device efficiently unloads the left ventricle in neonate lambs.J Thorac Cardiovasc Surg. 2017 Jan;153(1):175-182. doi: 10.1016/j.jtcvs.2016.08.041. Epub 2016 Aug 31. J Thorac Cardiovasc Surg. 2017. PMID: 27692763 Free PMC article.
-
The impact of small movements with dual lumen cannulae during venovenous extracorporeal membrane oxygenation: A computational fluid dynamics analysis.Comput Methods Programs Biomed. 2024 Jun;250:108186. doi: 10.1016/j.cmpb.2024.108186. Epub 2024 Apr 18. Comput Methods Programs Biomed. 2024. PMID: 38692252
References
-
- Dang NC, Topkara VK, Mercando M, Kay J, Kruger KH, Aboodi MS, et al. Right heart failure after left ventricular assist device implantation in patients with chronic congestive heart failure. J Heart Lung Transplant. 2006;25:1–6. - PubMed
-
- Kavarana MN, Pessin-Minsley MS, Urtecho J, Catanese KA, Flannery M, Oz MC, et al. Right ventricular dysfunction and organ failure in left ventricular assist device recipients: a continuing problem. Ann Thorac Surg. 2002;73:745–50. - PubMed
-
- Ochiai Y, McCarthy PM, Smedira NG, Banbury MK, Navia JL, Feng J, et al. Predictors of severe right ventricular failure after implantable left ventricular assist device insertion: analysis of 245 patients. Circulation. 2002;106:I198–202. - PubMed
Grants and funding
LinkOut - more resources
Full Text Sources
Other Literature Sources
Miscellaneous