

Modelling the impact and control of an infectious disease in a plant nursery with infected plant material inputs
- PMID: 27570364
- PMCID: PMC4913553
- DOI: 10.1016/j.ecolmodel.2016.04.013
Modelling the impact and control of an infectious disease in a plant nursery with infected plant material inputs
Abstract
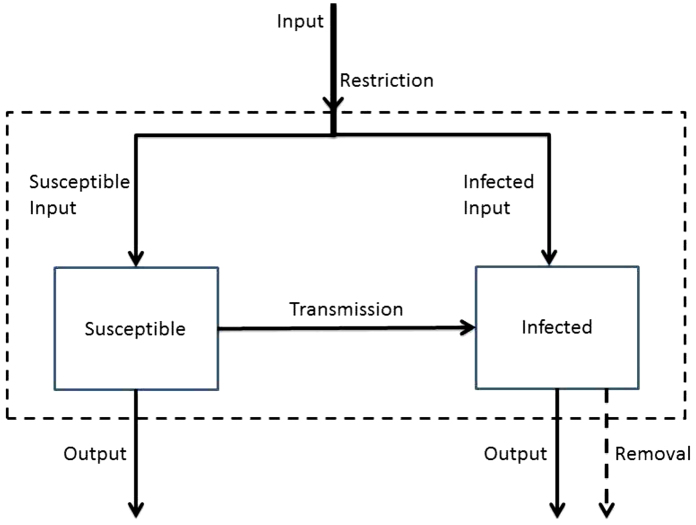
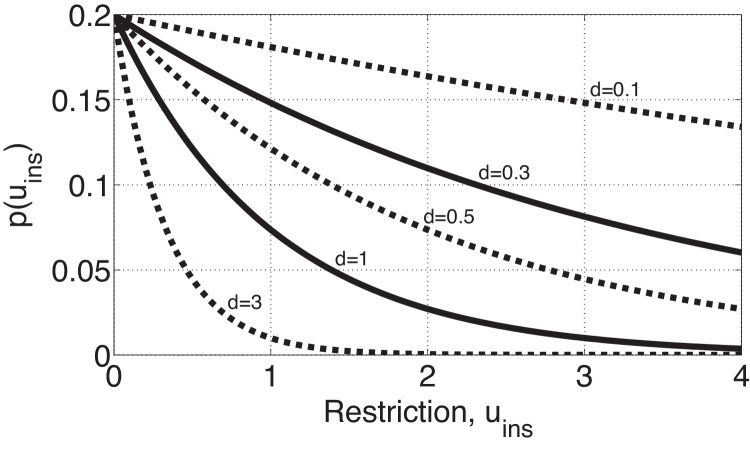
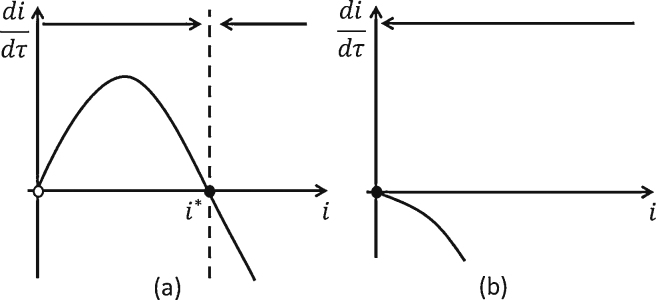
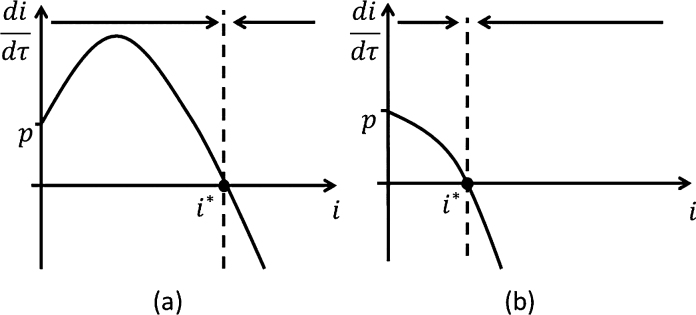
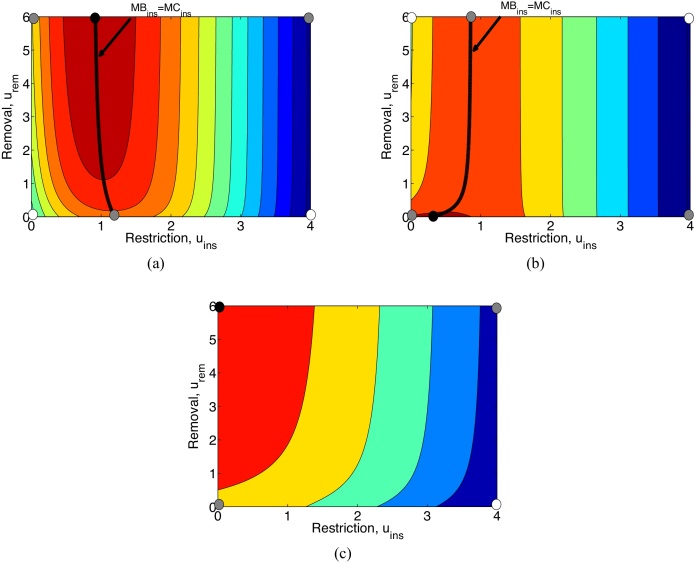
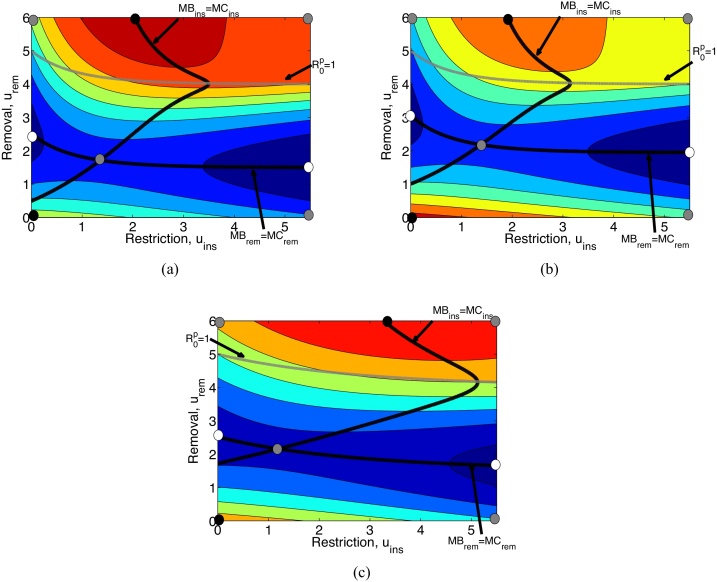
The ornamental plant trade has been identified as a key introduction pathway for plant pathogens. Establishing effective biosecurity measures to reduce the risk of plant pathogen outbreaks in the live plant trade is therefore important. Management of invasive pathogens has been identified as a weakest link public good, and thus is reliant on the actions of individual private agents. This paper therefore provides an analysis of the impact of the private agents' biosecurity decisions on pathogen prevention and control within the plant trade. We model the impact that an infectious disease has on a plant nursery under a constant pressure of potentially infected input plant materials, like seeds and saplings, where the spread of the disease reduces the value of mature plants. We explore six scenarios to understand the influence of three key bioeconomic parameters; the disease's basic reproductive number, the loss in value of a mature plant from acquiring an infection and the cost-effectiveness of restriction. The results characterise the disease dynamics within the nursery and explore the trade-offs and synergies between the optimal level of efforts on restriction strategies (actions to prevent buying infected inputs), and on removal of infected plants in the nursery. For diseases that can be easily controlled, restriction and removal are substitutable strategies. In contrast, for highly infectious diseases, restriction and removal are often found to be complementary, provided that restriction is cost-effective and the optimal level of removal is non-zero.
Keywords: Bioeconomic model; Optimal control; Plant disease; Plant nursery model.
Figures
Similar articles
-
Monitoring invasive pathogens in plant nurseries for early-detection and to minimise the probability of escape.J Theor Biol. 2016 Oct 21;407:290-302. doi: 10.1016/j.jtbi.2016.07.041. Epub 2016 Jul 28. J Theor Biol. 2016. PMID: 27477202
-
Modelling plant virus epidemics in a plantation-nursery system.IMA J Math Appl Med Biol. 2002 Jun;19(2):75-94. IMA J Math Appl Med Biol. 2002. PMID: 12630773
-
On a handshake: business-to-business trust in the biosecurity behaviours of the UK live plant trade.Biol Invasions. 2023;25(8):2531-2547. doi: 10.1007/s10530-023-03054-y. Epub 2023 Apr 4. Biol Invasions. 2023. PMID: 37366402 Free PMC article.
-
Review: The future of plant pathogen diagnostics in a nursery production system.Biosens Bioelectron. 2019 Dec 1;145:111631. doi: 10.1016/j.bios.2019.111631. Epub 2019 Aug 23. Biosens Bioelectron. 2019. PMID: 31574353 Review.
-
Eco-Epidemiological Uncertainties of Emerging Plant Diseases: The Challenge of Predicting Xylella fastidiosa Dynamics in Novel Environments.Phytopathology. 2020 Nov;110(11):1740-1750. doi: 10.1094/PHYTO-03-20-0098-RVW. Epub 2020 Oct 8. Phytopathology. 2020. PMID: 32954988 Review.
Cited by
-
Fusarioid community diversity associated with conifer seedlings in forest nurseries across the contiguous USA.Front Plant Sci. 2023 Jan 25;14:1104675. doi: 10.3389/fpls.2023.1104675. eCollection 2023. Front Plant Sci. 2023. PMID: 36818886 Free PMC article.
-
What makes or breaks a campaign to stop an invading plant pathogen?PLoS Comput Biol. 2020 Feb 6;16(2):e1007570. doi: 10.1371/journal.pcbi.1007570. eCollection 2020 Feb. PLoS Comput Biol. 2020. PMID: 32027649 Free PMC article.
-
Utility of decision tools for assessing plant health risks from management strategies in natural environments.Ecol Evol. 2024 May 2;14(5):e11308. doi: 10.1002/ece3.11308. eCollection 2024 May. Ecol Evol. 2024. PMID: 38706934 Free PMC article.
-
A review of plant leaf fungal diseases and its environment speciation.Bioengineered. 2019 Dec;10(1):409-424. doi: 10.1080/21655979.2019.1649520. Bioengineered. 2019. PMID: 31502497 Free PMC article. Review.
References
-
- Anderson R., May R. Oxford University Press; 1991. Infectious Diseases of Humans: Dynamics and Control.
-
- Anderson P.K., Cunningham A.A., Patel N.G., Morales F.J., Epstein P.R., Daszak P. Emerging infectious diseases of plants: pathogen pollution, climate change and agrotechnology drivers. Trends Ecol. Evol. 2004;19(10):535–544. - PubMed
-
- Barbier E.B., Gwatipedza J., Knowler D., Reichard S.H. The North American horticultural industry and the risk of plant invasion. Agric. Econ. 2011;42:113–129.
-
- Barbier E.B., Knowler D., Gwatipedza J., Reichard S.H., Hodges A.R. Implementing policies to control invasive plant species. BioScience. 2013;63:132–138.
-
- Brasier C., Webber J. Plant pathology: sudden larch death. Nature. 2010;466:824–825. - PubMed
LinkOut - more resources
Full Text Sources
Other Literature Sources