. 2016 Apr;17(4):1492-1510.
doi: 10.1002/2016GC006299. Epub 2016 Apr 29.

Orbitally paced phosphogenesis in Mediterranean shallow marine carbonates during the middle Miocene Monterey event

Affiliations

Orbitally paced phosphogenesis in Mediterranean shallow marine carbonates during the middle Miocene Monterey event

Gerald Auer et al. Geochem Geophys Geosyst. 2016 Apr.

Abstract

During the Oligo-Miocene, major phases of phosphogenesis occurred in the Earth's oceans. However, most phosphate deposits represent condensed or allochthonous hemipelagic deposits, formed by complex physical and chemical enrichment processes, limiting their applicability for the study regarding the temporal pacing of Miocene phosphogenesis. The Oligo-Miocene Decontra section located on the Maiella Platform (central Apennines, Italy) is a widely continuous carbonate succession deposited in a mostly middle to outer neritic setting. Of particular interest are the well-winnowed grain to packstones of the middle Miocene Bryozoan Limestone, where occurrences of authigenic phosphate grains coincide with the prominent carbon isotope excursion of the Monterey event. This unique setting allows the analysis of orbital forcing on phosphogenesis, within a bio, chemo, and cyclostratigraphically constrained age-model. LA-ICP-MS analyses revealed a significant enrichment of uranium in the studied authigenic phosphates compared to the surrounding carbonates, allowing natural gamma-radiation (GR) to be used as a qualitative proxy for autochthonous phosphate content. Time series analyses indicate a strong 405 kyr eccentricity forcing of GR in the Bryozoan Limestone. These results link maxima in the GR record and thus phosphate content to orbitally paced increases in the burial of organic carbon, particularly during the carbon isotope maxima of the Monterey event. Thus, phosphogenesis during the middle Miocene in the Mediterranean was controlled by the 405 kyr eccentricity and its influence on large-scale paleoproductivity patterns. Rare earth element data were used as a tool to reconstruct the formation conditions of the investigated phosphates, indicating generally oxic formation conditions, which are consistent with microbially mediated phosphogenesis.

Keywords: Monterey event; middle Miocene; natural gamma radiation; orbital forcing; paleoceanography; phosphogenesis.


Figures

Figure 1
Figure 1
(a) Location Map of the Decontra section, showing its geographical position near the village of Decontra in Central Italy. Colors in the measured section correspond to the informal lithostratigraphic units assigned in figure 2 [after Reuter et al., 2013]. (b) Paleogeographical map of the area during the late Oligocene and Miocene [Patacca et al., 2008], modified after Brandano et al. [2012]. Map shows the isolated nature of the Maiella carbonate system on the northern fringe of the Apulian platform. Major domains depicted are: (1) Paleogene mountain chains; (2) Mesozoic‐Cenozoic carbonate platform domains; (3) pelagic plateaus; (4) basin domains; (5) deep‐water basins floored by oceanic or thinned continental crust; and (6) fronts of orogenic belts.
Figure 2
Figure 2
Lithology and orbitally tuned age model shown together with stratigraphic tie‐points of the Decontra section and the Bryozoan Limestone (yellow) with occurrences of intervals rich in planktonic foraminifera (olive) [Auer et al., 2015; Reuter et al., 2013]. Natural gamma‐radiation is shown as total counts per second, with a Gaussian band‐pass filter applied to the frequency peak corresponding to the orbital 405 kyr eccentricity cycle (see Fig. 3) used as a proxy for long‐term phosphate accumulation in the sediment. Maxima in the gamma‐ray data were correlated to the carbon isotope maxima (CM‐) events [see Holbourn et al., 2007], occurring during the Monterey event (highlighted in pink) TOC (black) and carbon isotope (red) curves are plotted adjacent to the gamma‐ray signal. The benthic carbon isotope stack of Zachos et al. [2008] is shown for comparison.
Figure 3
Figure 3
REDFIT power spectrum of the gamma‐ray data from the Bryozoan Limestone [Auer et al., 2015]. 99% and 95% Monte‐Carlo corrected confidence intervals are shown as green and red lines, respectively. Frequency‐peaks corresponding to orbital cycles are labeled in kyr, based on sedimentation rate estimates using the stratigraphic model of Reuter et al. [2013], Auer et al. [2015].
Figure 4
Figure 4
Cross plots showing the relationship between 60 cm average of natural gamma‐radiation field data given in counts per seconds (CPS) and the P2O5 (a) and K2O (b) content of corresponding bulk samples. Correlation coefficient (r) for the respective data sets are shown in the lower right of the plots. High correlation and more inclined regression line indicate a stronger dependency of gamma‐ray intensity on P2O5 compared to K2O. This indicates that U bearing phosphates and not K bearing clays (i.e., glauconite) are the dominant gamma‐ray source.
Figure 5
Figure 5
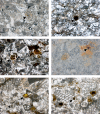
Transmitted (a–c, e, f) and reflected (d) light micrographs of thin sections from the Bryozoan Limestone, Scale bar = 200 µm. (a) Sample DC3‐20B. Arrow shows minor phosphatisation of the chambers of Amphistegina sp.; sample has generally low phosphate contents corresponding to the gamma‐ray trough before CM 4b (cf. Figure 2). (b) Diffuse authigenic phosphate coating grains in a sample dominated by planktonic foraminifers (some phosphatized). Sample shows generally high phosphate contents, corresponding to a peak in the gamma‐ray data (Figure 2; DC3‐21J). Black arrow indicates a phosphatized peloidal coprolite surrounded by diffuse phosphate (c) Transmitted light image of a plankton rich bryozoan fragment grainstone; sample DC3‐21C. Phosphates occur as diffuse clusters within the sample; white arrow indicates a phosphatized hyaline foraminiferal test. (d) Corresponding reflected light image to Figure 5c; black arrow indicates iron oxide located in the center of a dense phosphate cluster. (e) Bryozoan fragment and planktonic foraminifers (e.g., Orbulina sp.) dominated grainstone with diffuse phosphates associated with microbial micrite. Black arrow: well‐rounded detrital phosphate grain. Sample DC3‐21H. (f) Bryozoan fragment dominated grainstone, with microbial micrite and diffuse authigenic phosphorite in diffuse aggregates that are following grain boundaries (white arrowhead) or are emplaced in micrite; black arrow indicates a reworked glauconite grain; sample DC3‐21H (see Figure 6 for BSE images showing a similar features).
Figure 6
Figure 6
(a) Thick filamentous phosphate (Sample DC3‐21B); (b) fine filamentous phosphate aggregate (Sample DC3‐21H). This phosphate type is associated with the thin diffuse layers shown in Figure 5f. BSE image of a thick section prepared for LA‐ICP‐MS analyses (sample: DC3‐21D; see Figure 2). Light grey areas in the BSE image correspond to phosphate grains (CFA), bright white areas correspond to iron oxides (OX), and darker grey areas correspond to minor occurrences of glauconites (Glt) within the carbonates (medium gray area) of the Bryozoan Limestone. White square in the BSE image represents the area shown in the EPMA elemental distribution maps of Phosphorous (P); note the diffuse authigenic phosphate in upper left associated with a phosphatized benthic foraminiferal test, Iron (Fe) was used to trace iron oxides; together with Aluminum (Al) and Silica (Si) indicates silicates like authigenic glauconite. The black spot represents an ablation crater left by the LA‐ICP‐MS analysis.
Figure 7
Figure 7
Ce/Ce* versus Pr/Pr* plot after Bau and Dulski [1996]. Garnit et al. [2012] described the fields of the plot as follows: Field I: no anomaly; Field IIa: positive La anomaly causes apparent negative Ce anomaly; Field IIb: negative La anomaly causes apparent positive Ce anomaly; Field IIIa: real positive Ce anomaly; Field IIIb: real negative Ce anomaly; Field IV: positive La anomaly disguises positive Ce anomaly. Using this interpretation, all analyzed phosphates as well as biogenic carbonates plot in the IIIb field, indicating the presence of a real negative Ce anomaly, indicative of oxic formation conditions.
Figure 8
Figure 8
(La/Yb)n versus (La/Sm)n ratio plot of both phosphate and carbonate reported in the diagram proposed by Reynard et al. [1999] and redrawn after Garnit et al. [2012]. Plot indicates that while all analyzed samples are still broadly similar to modern day seawater (note that some samples of both phosphate and carbonate plot within the “modern seawater” field), both adsorption and substitution processes affected the investigated samples to a minor degree. This is in agreement with the current interpretation, indicating early diagenetic formation (i.e., authigenic) or biogenic formation as well as prolonged exposure to seawater in a high current‐energy deposition system with generally low sedimentation rates.
Figure 9
Figure 9
Box model of the processes involved leading to phosphogenesis on the Maiella carbonate ramp. Orbitally paced primary productivity causes increased marine snow. The sinking organic matter within the marine snow takes up uranium from the seawater and transports it to the ocean floor. At the ocean floor, OM acts as the limiting factor for the establishment of microbial communities. Microbial communities also protect the organic matter from winnowing by current activity. Phosphorous is concentrated in the OM and is also taken up directly from the ocean water by the microbial communities at the ocean floor. Decomposition of both primary and microbial mat derived organic matter within the sediment provides both phosphorous and uranium, which is then incorporated into carbonate fluor apatite during primary phosphogenesis within the oxic anoxic transition zone (OATZ) in the sediment.

Similar articles

References

    1. Abels, H. A. , Hilgen F. J., Krijgsman W., Kruk R. W., Raffi I., Turco E., and Zachariasse W. J. (2005), Long‐period orbital control on middle Miocene global cooling: Integrated stratigraphy and astronomical tuning of the Blue Clay Formation on Malta, Paleoceanography, 20, PA4012, doi:10.1029/2004PA001129. - DOI
    1. Aissaoui, D. M. , McNeil D. F., and Kirschvink J. L. (1990), Magnetostratigraphic dating of shallow‐water carbonates from Mururoa atoll, French Polynesia: Implications for global eustasy, Earth Planet. Sci. Lett., 97(1–2), 102–112, doi:10.1016/0012-821X(90)90102-4. - DOI
    1. Alibo, D. S. , and Nozaki Y. (1999), Rare earth elements in seawater: Particle association, shale‐normalization, and Ce oxidation, Geochim. Cosmochim. Acta, 63(3–4), 363–372, doi:10.1016/S0016-7037(98)00279-8. - DOI
    1. Anderson, R. F. (1982), Concentration, vertical flux, and remineralization of particulate uranium in seawater, Geochim. Cosmochim. Acta, 46(7), 1293–1299, doi:10.1016/0016-7037(82)90013-8. - DOI
    1. Arning, E. T. , Birgel D., Brunner B., and Peckmann J. (2009), Bacterial formation of phosphatic laminites off Peru, Geobiology, 7(3), 295–307, doi:10.1111/j.1472-4669.2009.00197.x. - DOI - PubMed