

Automated Detection of Lupus White Matter Lesions in MRI
- PMID: 27570507
- PMCID: PMC4981618
- DOI: 10.3389/fninf.2016.00033
Automated Detection of Lupus White Matter Lesions in MRI
Abstract
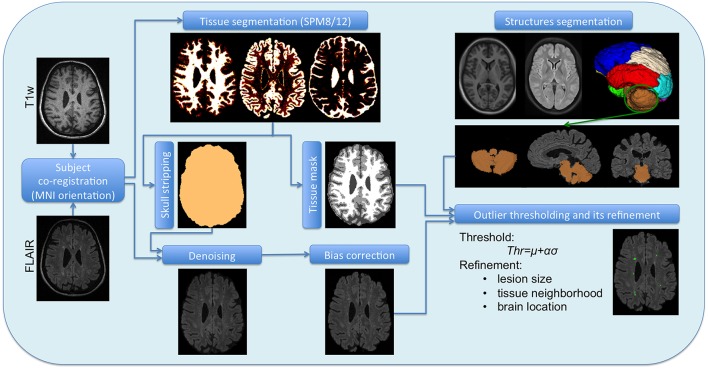
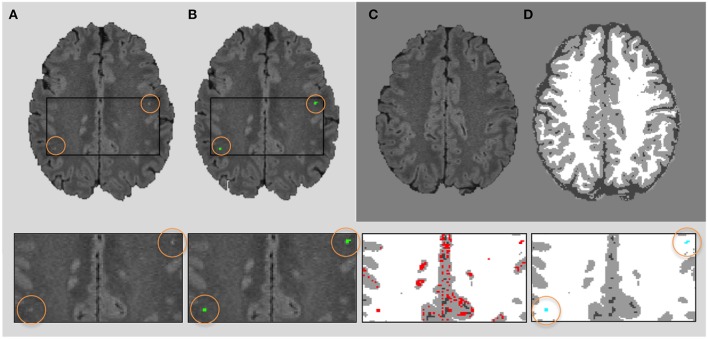
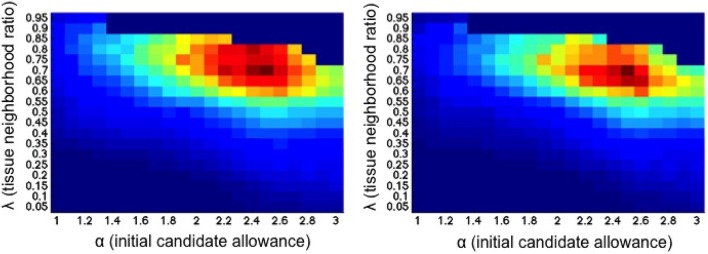
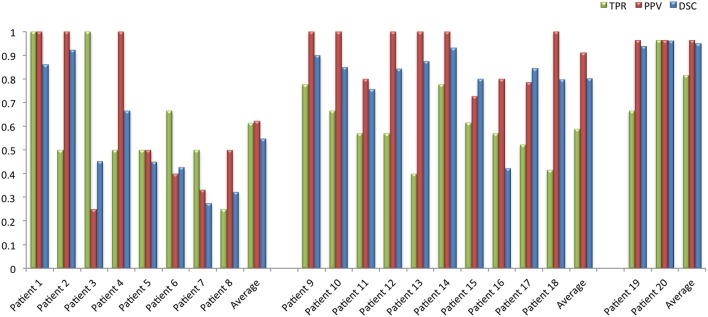
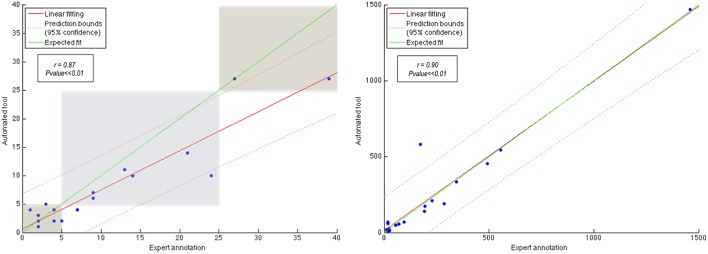
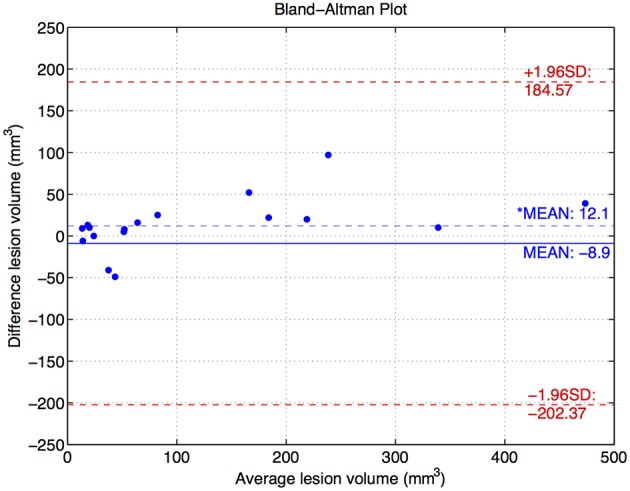
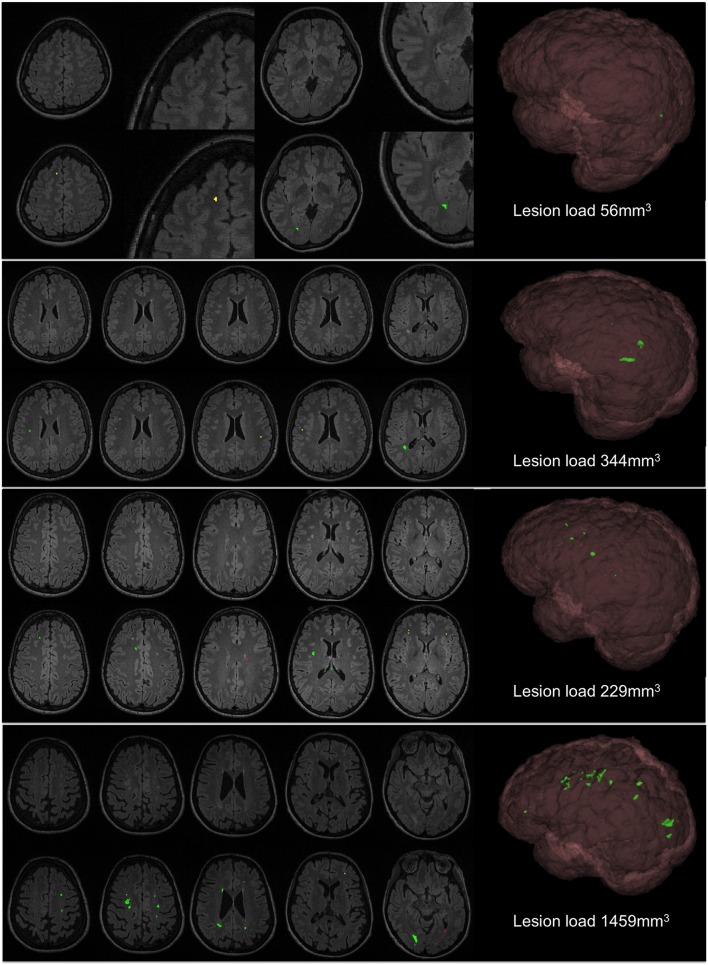
Brain magnetic resonance imaging provides detailed information which can be used to detect and segment white matter lesions (WML). In this work we propose an approach to automatically segment WML in Lupus patients by using T1w and fluid-attenuated inversion recovery (FLAIR) images. Lupus WML appear as small focal abnormal tissue observed as hyperintensities in the FLAIR images. The quantification of these WML is a key factor for the stratification of lupus patients and therefore both lesion detection and segmentation play an important role. In our approach, the T1w image is first used to classify the three main tissues of the brain, white matter (WM), gray matter (GM), and cerebrospinal fluid (CSF), while the FLAIR image is then used to detect focal WML as outliers of its GM intensity distribution. A set of post-processing steps based on lesion size, tissue neighborhood, and location are used to refine the lesion candidates. The proposal is evaluated on 20 patients, presenting qualitative, and quantitative results in terms of precision and sensitivity of lesion detection [True Positive Rate (62%) and Positive Prediction Value (80%), respectively] as well as segmentation accuracy [Dice Similarity Coefficient (72%)]. Obtained results illustrate the validity of the approach to automatically detect and segment lupus lesions. Besides, our approach is publicly available as a SPM8/12 toolbox extension with a simple parameter configuration.
Keywords: automatic lesion detection and segmentation; image analysis; lupus disease; magnetic resonance images.
Figures
Similar articles
-
A toolbox for multiple sclerosis lesion segmentation.Neuroradiology. 2015 Oct;57(10):1031-43. doi: 10.1007/s00234-015-1552-2. Epub 2015 Jul 31. Neuroradiology. 2015. PMID: 26227167
-
Patient-specific 3D FLAIR for enhanced visualization of brain white matter lesions in multiple sclerosis.J Magn Reson Imaging. 2017 Aug;46(2):557-564. doi: 10.1002/jmri.25557. Epub 2016 Nov 21. J Magn Reson Imaging. 2017. PMID: 27869333
-
White matter lesion extension to automatic brain tissue segmentation on MRI.Neuroimage. 2009 May 1;45(4):1151-61. doi: 10.1016/j.neuroimage.2009.01.011. Neuroimage. 2009. PMID: 19344687
-
Imaging of white matter lesions.Cerebrovasc Dis. 2002;13 Suppl 2:21-30. doi: 10.1159/000049146. Cerebrovasc Dis. 2002. PMID: 11901239 Review.
-
Pathogeneses and Imaging Features of Cerebral White Matter Lesions of Vascular Origins.Aging Dis. 2021 Dec 1;12(8):2031-2051. doi: 10.14336/AD.2021.0414. eCollection 2021 Dec. Aging Dis. 2021. PMID: 34881084 Free PMC article. Review.
Cited by
-
Automated Segmentation of Tissues Using CT and MRI: A Systematic Review.Acad Radiol. 2019 Dec;26(12):1695-1706. doi: 10.1016/j.acra.2019.07.006. Epub 2019 Aug 10. Acad Radiol. 2019. PMID: 31405724 Free PMC article.
-
Alterations in cerebral distal vascular features and effect on cognition in a high cardiovascular risk population: A prospective longitudinal study.Magn Reson Imaging. 2023 May;98:36-43. doi: 10.1016/j.mri.2022.12.011. Epub 2022 Dec 22. Magn Reson Imaging. 2023. PMID: 36567002 Free PMC article.
-
Associations of intracranial artery length and branch number on non-contrast enhanced MRA with cognitive impairment in individuals with carotid atherosclerosis.Sci Rep. 2022 May 6;12(1):7456. doi: 10.1038/s41598-022-11418-y. Sci Rep. 2022. PMID: 35524158 Free PMC article.
-
Automatic brain lesion segmentation on standard magnetic resonance images: a scoping review.BMJ Open. 2021 Jan 29;11(1):e042660. doi: 10.1136/bmjopen-2020-042660. BMJ Open. 2021. PMID: 33514580 Free PMC article.
-
Fulminant Brain Atrophy and Vasculitis on Vessel-Wall Imaging in Neuropsychiatric Lupus: Case Report and Literature Review.Arch Rheumatol. 2020 Jan 8;35(3):443-448. doi: 10.46497/ArchRheumatol.2020.7544. eCollection 2020 Sep. Arch Rheumatol. 2020. PMID: 33458670 Free PMC article.
References
LinkOut - more resources
Full Text Sources
Other Literature Sources