

Origination, Expansion, Evolutionary Trajectory, and Expression Bias of AP2/ERF Superfamily in Brassica napus
- PMID: 27570529
- PMCID: PMC4982375
- DOI: 10.3389/fpls.2016.01186
Origination, Expansion, Evolutionary Trajectory, and Expression Bias of AP2/ERF Superfamily in Brassica napus
Abstract
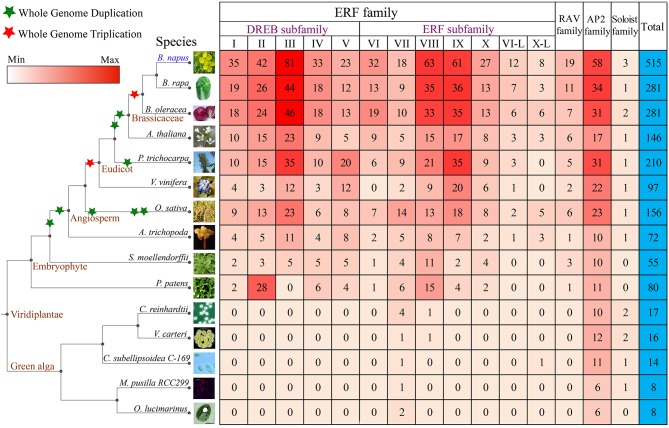
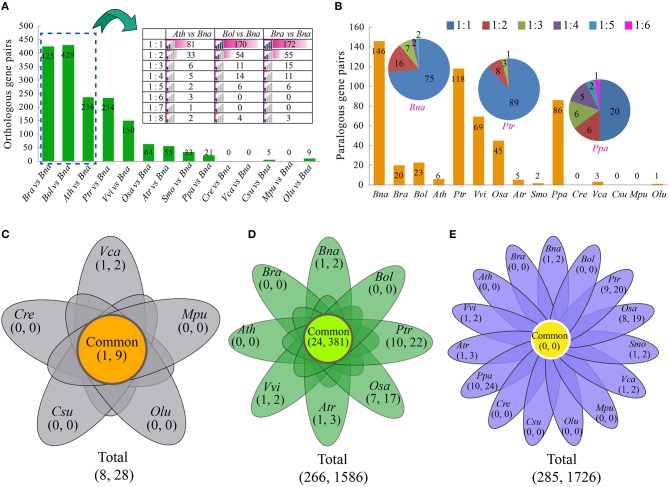
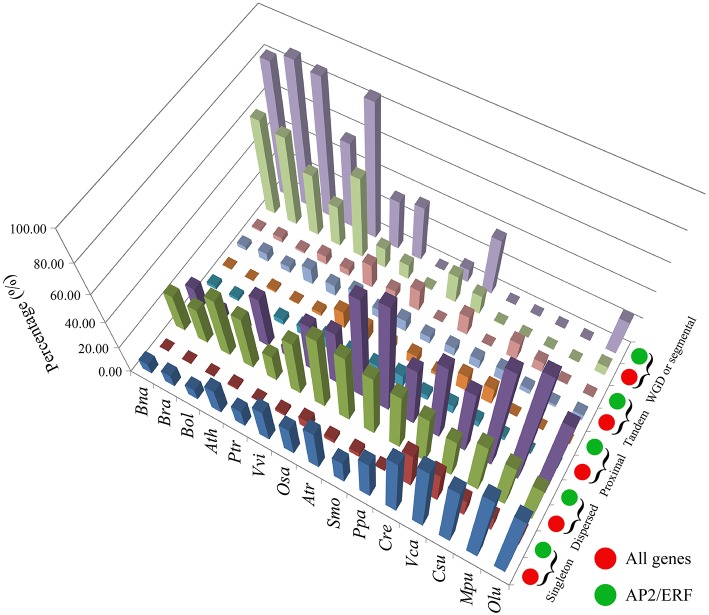
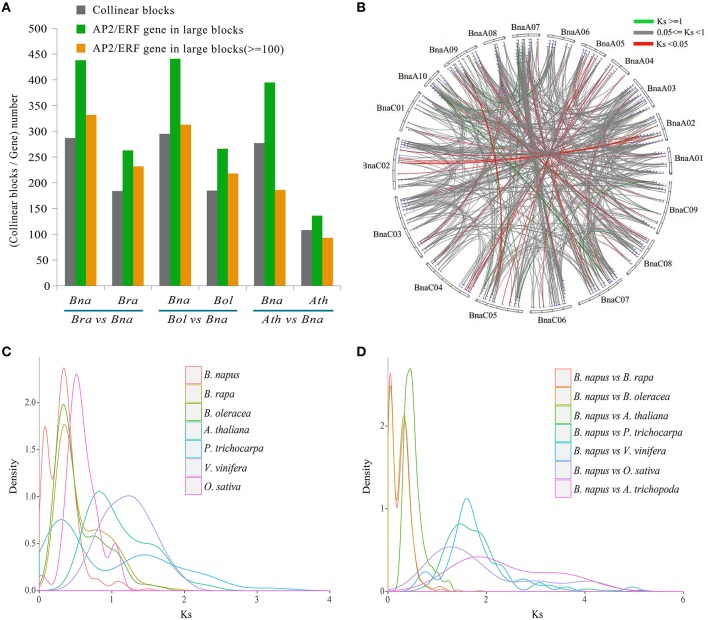
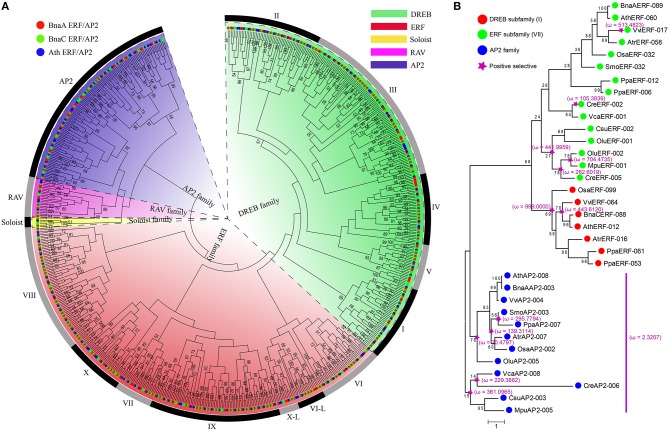
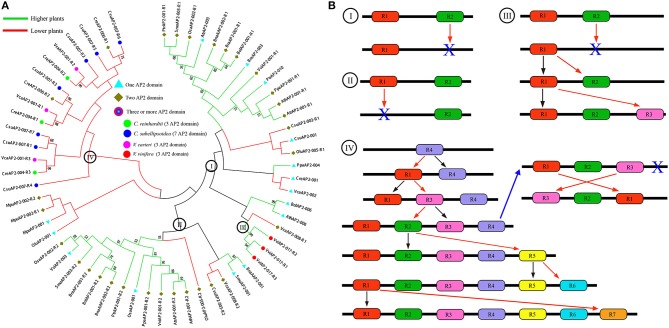
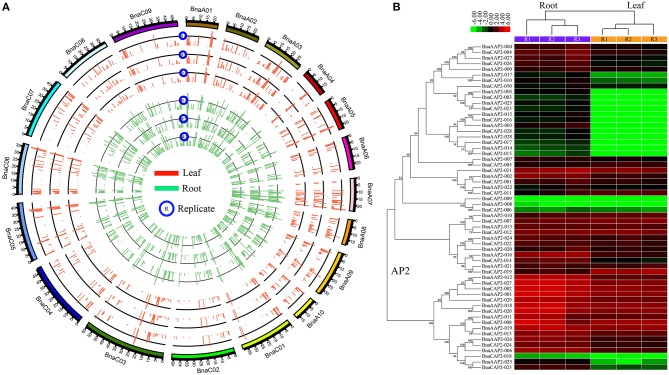
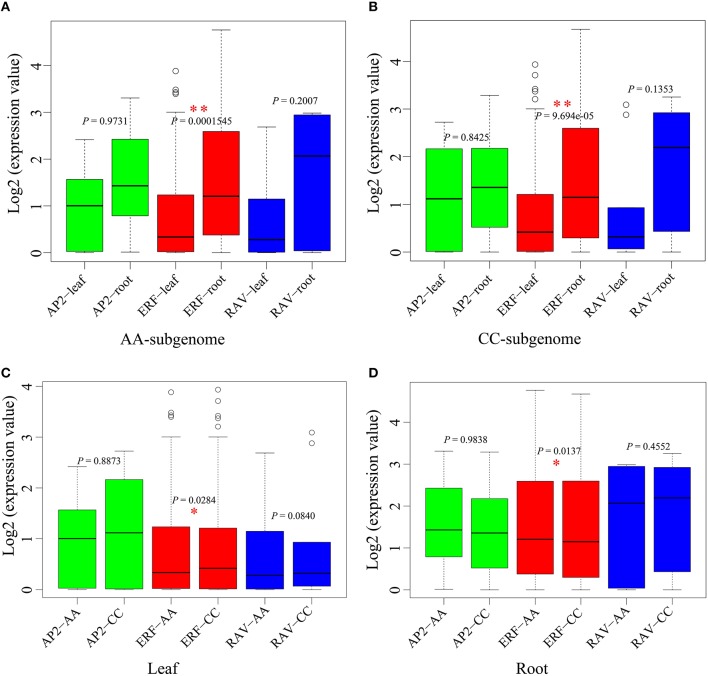
The AP2/ERF superfamily, one of the most important transcription factor families, plays crucial roles in response to biotic and abiotic stresses. So far, a comprehensive evolutionary inference of its origination and expansion has not been available. Here, we identified 515 AP2/ERF genes in B. napus, a neo-tetraploid forming ~7500 years ago, and found that 82.14% of them were duplicated in the tetraploidization. A prominent subgenome bias was revealed in gene expression, tissue-specific, and gene conversion. Moreover, a large-scale analysis across plants and alga suggested that this superfamily could have been originated from AP2 family, expanding to form other families (ERF, and RAV). This process was accompanied by duplicating and/or alternative deleting AP2 domain, intragenic domain sequence conversion, and/or by acquiring other domains, resulting in copy number variations, alternatively contributing to functional innovation. We found that significant positive selection occurred at certain critical nodes during the evolution of land plants, possibly responding to changing environment. In conclusion, the present research revealed origination, functional innovation, and evolutionary trajectory of the AP2/ERF superfamily, contributing to understanding their roles in plant stress tolerance.
Keywords: AP2/ERF superfamily; B. napus; RNA-seq; polyploid; positive selection; stress tolerance.
Figures
Similar articles
-
Dynamic transcriptome analysis reveals AP2/ERF transcription factors responsible for cold stress in rapeseed (Brassica napus L.).Mol Genet Genomics. 2016 Jun;291(3):1053-67. doi: 10.1007/s00438-015-1161-0. Epub 2016 Jan 4. Mol Genet Genomics. 2016. PMID: 26728151
-
Comprehensive analyses of the BES1 gene family in Brassica napus and examination of their evolutionary pattern in representative species.BMC Genomics. 2018 May 9;19(1):346. doi: 10.1186/s12864-018-4744-4. BMC Genomics. 2018. PMID: 29743014 Free PMC article.
-
Expansion and stress responses of the AP2/EREBP superfamily in cotton.BMC Genomics. 2017 Jan 31;18(1):118. doi: 10.1186/s12864-017-3517-9. BMC Genomics. 2017. PMID: 28143399 Free PMC article.
-
Ethylene responsive factors in the orchestration of stress responses in monocotyledonous plants.Front Plant Sci. 2015 Aug 28;6:640. doi: 10.3389/fpls.2015.00640. eCollection 2015. Front Plant Sci. 2015. PMID: 26379679 Free PMC article. Review.
-
AP2/ERF Transcription Factor Regulatory Networks in Hormone and Abiotic Stress Responses in Arabidopsis.Front Plant Sci. 2019 Feb 28;10:228. doi: 10.3389/fpls.2019.00228. eCollection 2019. Front Plant Sci. 2019. PMID: 30873200 Free PMC article. Review.
Cited by
-
A tuber mustard AP2/ERF transcription factor gene, BjABR1, functioning in abscisic acid and abiotic stress responses, and evolutionary trajectory of the ABR1 homologous genes in Brassica species.PeerJ. 2018 Dec 11;6:e6071. doi: 10.7717/peerj.6071. eCollection 2018. PeerJ. 2018. PMID: 30581669 Free PMC article.
-
Identification and characterization of the Quinoa AP2/ERF gene family and their expression patterns in response to salt stress.Sci Rep. 2024 Nov 27;14(1):29529. doi: 10.1038/s41598-024-81046-1. Sci Rep. 2024. PMID: 39604476 Free PMC article.
-
Genome-Wide Identification of AP2/ERF Superfamily Genes in Juglans mandshurica and Expression Analysis under Cold Stress.Int J Mol Sci. 2022 Dec 3;23(23):15225. doi: 10.3390/ijms232315225. Int J Mol Sci. 2022. PMID: 36499551 Free PMC article.
-
Evolution of the DEHYDRATION-RESPONSIVE ELEMENT-BINDING PROTEIN subfamily in green plants.Plant Physiol. 2022 Aug 29;190(1):421-440. doi: 10.1093/plphys/kiac286. Plant Physiol. 2022. PMID: 35695786 Free PMC article.
-
Genome-Wide Analysis of the YABBY Transcription Factor Family in Rapeseed (Brassica napus L.).Genes (Basel). 2021 Jun 27;12(7):981. doi: 10.3390/genes12070981. Genes (Basel). 2021. PMID: 34199012 Free PMC article.
References
LinkOut - more resources
Full Text Sources
Other Literature Sources
Research Materials