. 2015 Jan;1(1):vev015.
doi: 10.1093/ve/vev015. Epub 2015 Jan 1.

Role of the host restriction factor APOBEC3 on papillomavirus evolution

Affiliations

Role of the host restriction factor APOBEC3 on papillomavirus evolution

Cody J Warren et al. Virus Evol. 2015 Jan.

Abstract

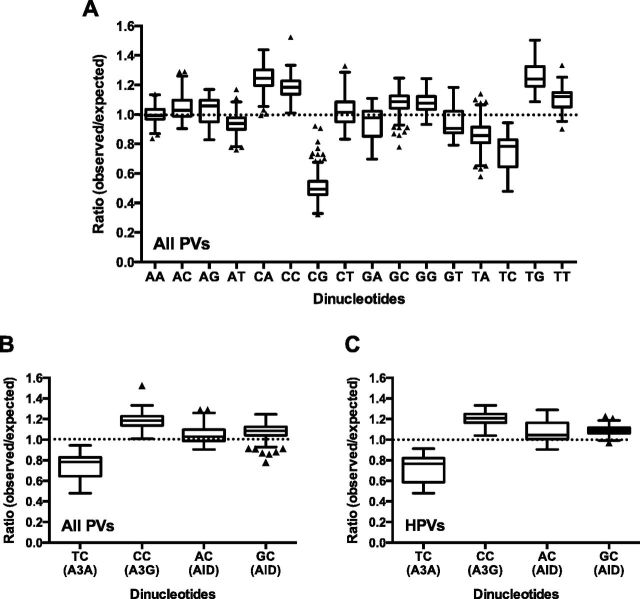
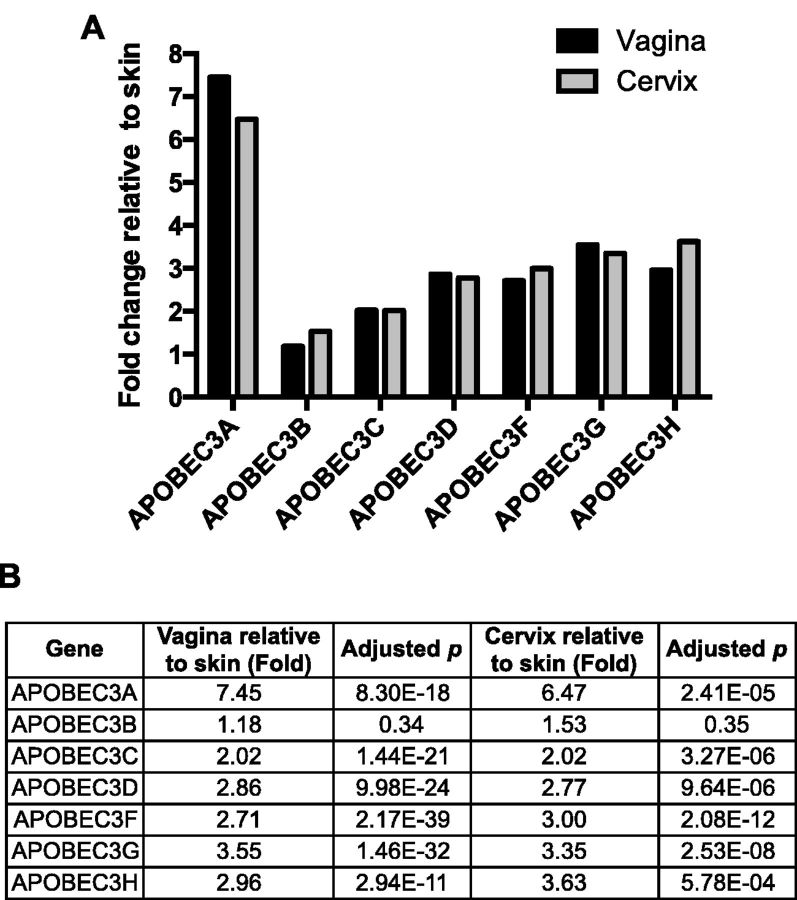
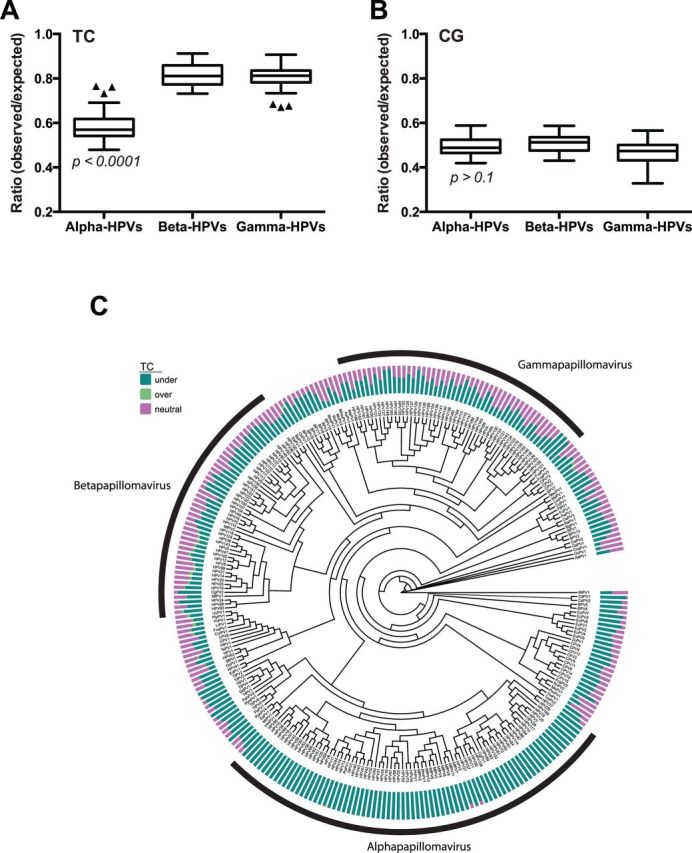
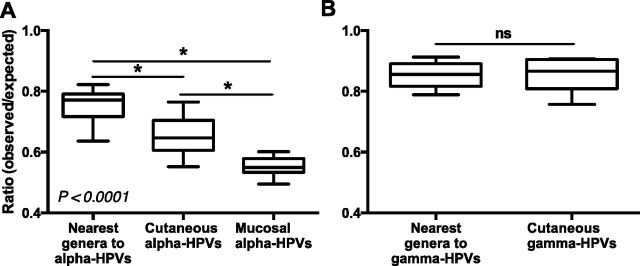
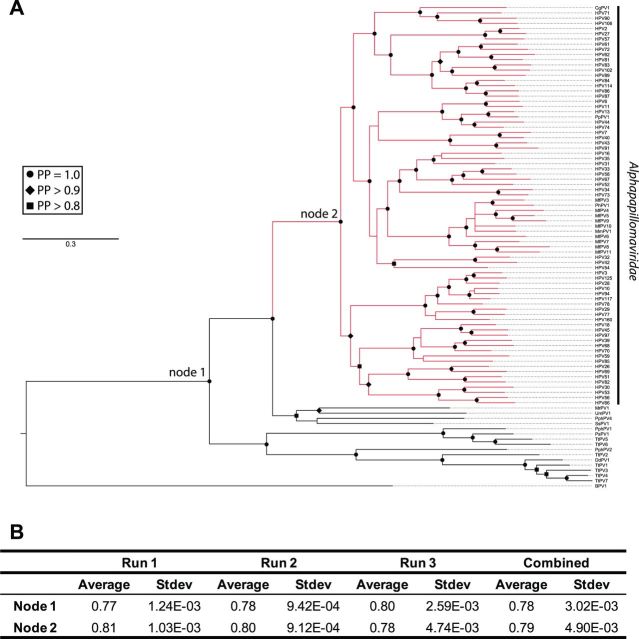
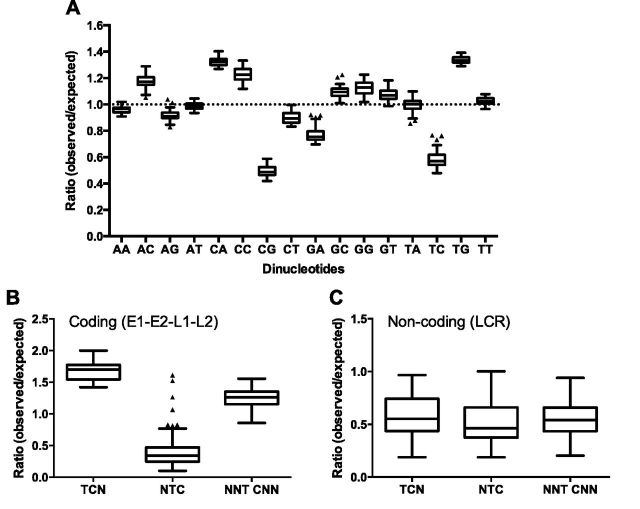
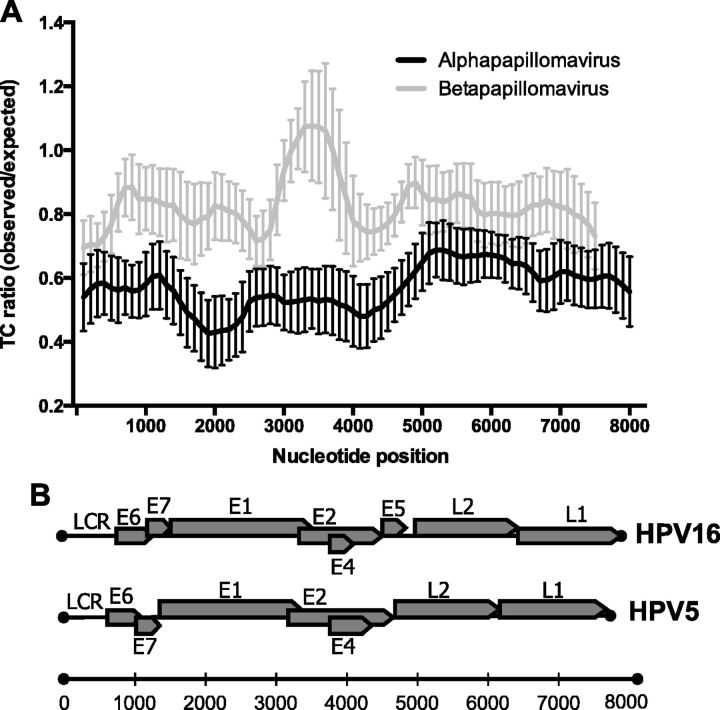
More than 270 different types of papillomaviruses have been discovered in a wide array of animal species. Despite the great diversity of papillomaviruses, little is known about the evolutionary processes that drive host tropism and the emergence of oncogenic genotypes. Although host defense mechanisms have evolved to interfere with various aspects of a virus life cycle, viruses have also coevolved copious strategies to avoid host antiviral restriction. Our and other studies have shown that the cytidine deaminase APOBEC3 family members edit HPV genomes and restrict virus infectivity. Thus, we hypothesized that host restriction by APOBEC3 served as selective pressure during papillomavirus evolution. To test this hypothesis, we analyzed the relative abundance of all dinucleotide sequences in full-length genomes of 274 papillomavirus types documented in the Papillomavirus Episteme database (PaVE). Here, we report that TC dinucleotides, the preferred target sequence of several human APOBEC3 proteins (hA3A, hA3B, hA3F, and hA3H), are highly depleted in papillomavirus genomes. Given that HPV infection is highly tissue-specific, the expression levels of APOBEC3 family members were analyzed. The basal expression levels of all APOBEC3 isoforms, excluding hA3B, are significantly higher in mucosal skin compared with cutaneous skin. Interestingly, we reveal that Alphapapillomaviruses (alpha-PVs), a majority of which infects anogenital mucosa, display the most dramatic reduction in TC dinucleotide content. Computer modeling and reconstruction of ancestral alpha-PV genomes suggest that TC depletion occurred after the alpha-PVs diverged from their most recent common ancestor. In addition, we found that TC depletion in alpha-PVs is greatly affected by protein coding potential. Taken together, our results suggest that PVs replicating in tissues with high APOBEC3 levels may have evolved to evade restriction by selecting for variants that contain reduced APOBEC3 target sites in their genomes.

Keywords: APOBEC3; coevolution; papillomavirus; restriction factor.


Conflict of interest statement

Conflicts of Interest: None declared

Figures

Figure 1.
Figure 1.
TC and CG dinucleotide sequences are significantly depleted in PV genomes. (A) The observed vs. expected (O/E) ratios of each dinucleotide in PV genome sequences from all PV genotypes (n = 274) were calculated using a custom wrapper around the CompSeq program from the EMBOSS software suite. (B) The O/E ratios of TC, CC, AC, and GC dinucleotides, preferred editing sites of A3A, A3G, and AID, respectively, were analyzed with the genome sequences of all PVs (A; n = 274) and HPVs (B; n = 161). Box-and-whisker plots are shown with the outliers (black triangles) identified using Tukey's method. CG and TC dinucleotide are the most depleted cytidine containing dinucleotides in all PVs and HPVs (depletion of CG or TC compared with depletion of any other dinucleotide, P < 0.0001 by two-way ANOVA with Tukey correction).
Figure 2.
Figure 2.
The expression levels of APOBEC3s are different between cervicovaginal and cutaneous skin. (A) Gene expression levels of APOBEC3s were analyzed using RNA sequencing data retrieved from the Genotype-Tissue Expression project database (gtexportal.org) (Lonsdale et al. 2013) and analyzed using DESeq2. Data are presented as fold change in cervix (n = 6) or vagina (n = 34) compared with cutaneous skin (n = 41). (B) Table showing the fold change and P-values adjusted for repeated measurements.
Figure 3.
Figure 3.
TC content is significantly lower in alpha-PVs, compared with beta- and gamma-PVs. The O/E ratios of TC (A) and CG (B) dinucleotides were compared between alpha- (n = 64), beta- (n = 44), and gamma- (n = 50) HPVs. Box-and-whisker plots are shown with the outliers (black triangles) identified using Tukey’s method. P-values were determined by one-way ANOVA analysis using Prism software. (C) A maximum likelihood phylogenetic tree is shown comparing the O/E ratios of TC dinucleotides from all PV genomes (n = 274). The alpha-, beta-, and gamma-PV genera are indicated. Bars indicate percent of 1 kb windows in which TC is under-represented (green), overrepresented (light green), and neutral (pink). Details are available in ‘Materials and Methods’ section.
Figure 4.
Figure 4.
Extensive TC dinucleotide depletion in mucosal alpha-HPVs. The O/E ratios of TC dinucleotides in PV genomes were analyzed with genome sequences of (A) nearest genera to alpha-HPVs (one omega, seven upsilon, four omikron, two dyodelta, and one unclassified PVs; n = 15), cutaneous alpha-HPVs (n = 13), and mucosal alpha-HPVs (n = 30); and (B) nearest genera to gamma-HPVs (six pi, one dyoxi, three tau, and two unclassified PVs; n = 12) and cutaneous gamma-HPVs (n = 7). Box-and-whisker plots are shown. P-values were calculated by Student’s unpaired, two-tailed t-test. *P < 0.0001, ns, not significant.
Figure 5.
Figure 5.
TC depletion represents an apomorphy of the alpha-PVs. (A) The Bayesian phylogenetic tree is constructed based on a concatenated E1-E2-L2-L1 nucleotide sequence alignment. The majority-rule consensus phylogenetic tree shows the evolutionary relationship between the alpha-PVs and the members of the omega, upsilon, omicron, and dyodelta-PV genera. BPV1, a delta-PV was used to root the tree. The solid branches indicate the optimized branch lengths. Dotted lines were added to the branches to facilitate visual inspection of the tree. The alpha-PV clade is highlighted in red. Posterior probability values are indicated using symbols at the nodes (circle = 1, diamond > 0.90, square > 0.80). The nodes for which the ancestral states were estimated are indicated in the figure. (B) Table showing the average (and SD) of the estimates for the ancestral TC ratios at the indicated nodes. The reconstruction process was repeated three times to ensure repeatability.
Figure 6.
Figure 6.
Depletion of TC dinucleotides is associated with amino acid coding potential. (A) The O/E ratios of each dinucleotide in alpha-HPV (n = 64) genome sequences was calculated as described in Figure 1A. (B) E1, E2, L1, and L2 sequences from alpha-HPVs were concatenated as described in ‘Materials and Methods’ section. The O/E ratios of TC dinucleotides at various codon positions were calculated as described in ‘Materials and Methods’ section. N represents any of T, C, A, or G. (C) The TC O/E ratios at NNT CNN, TCN, and NTC in the URR were calculated as a noncoding control. Box-and-whisker plots are shown with the outliers (black triangles) identified using Tukey’s method. CA and TG dinucleotides are the most over-represented dinucleotides, while NTC cytidines are significantly depleted in alpha-PVs. P < 0.0001 by two-way ANOVA analysis with Tukey correction.
Figure 7.
Figure 7.
The E1 and E2 gene regions of alpha-PV genomes are the most significantly depleted sites for TC dinucleotides. (A) TC O/E ratios were calculated in 1 kb scanning windows using the CompSeq program as described in ‘Materials and Methods’ section. All alpha- (n = 77) and beta-PVs (n = 49) genomes were included. Each window represents 1,000 kb with a 100 bp step between two windows. The viral genomes were linearized in such a way that the first nucleotide corresponds to the first nucleotide following the L1 stop codon. (B) Genome maps of HPV16 and HPV5, adapted from PaVE, show the various ORFs and URR for representative alpha- and beta-PVs, respectively.

Similar articles

Cited by

References

    1. Ahasan M. M., et al. (2015). ‘APOBEC3A and C Decrease Human Papillomavirus 16 Pseudovirion Infectivity’, Biochemical and Biophysical Research Communications, 457: 295–9. - PubMed
    1. Barker D., Meade A., Pagel M. (2007). ‘Constrained Models of Evolution Lead to Improved Prediction of Functional Linkage from Correlated Gain and Loss of Genes’, Bioinformatics, 23: 14–20. - PubMed
    1. Betts M. J., Russell R. B. (2003). ‘Amino Acid Properties and Consequences of Substitutions’, Bioinformatics for Geneticists, 317: 289.
    1. Bogerd H. P., et al. (2006). ‘APOBEC3A and APOBEC3B are Potent Inhibitors of LTR-Retrotransposon Function in Human Cells’, Nucleic Acids Research 34: 89–95. - PMC - PubMed
    1. Bravo I. G., Félez-Sánchez M. (2015). ‘Papillomaviruses: Viral Evolution, Cancer and Evolutionary Medicine’, Evolution, Medicine and Public Health, 2015: 32–51. - PMC - PubMed