

Phase-stable swept source OCT angiography in human skin using an akinetic source
- PMID: 27570695
- PMCID: PMC4986811
- DOI: 10.1364/BOE.7.003032
Phase-stable swept source OCT angiography in human skin using an akinetic source
Abstract
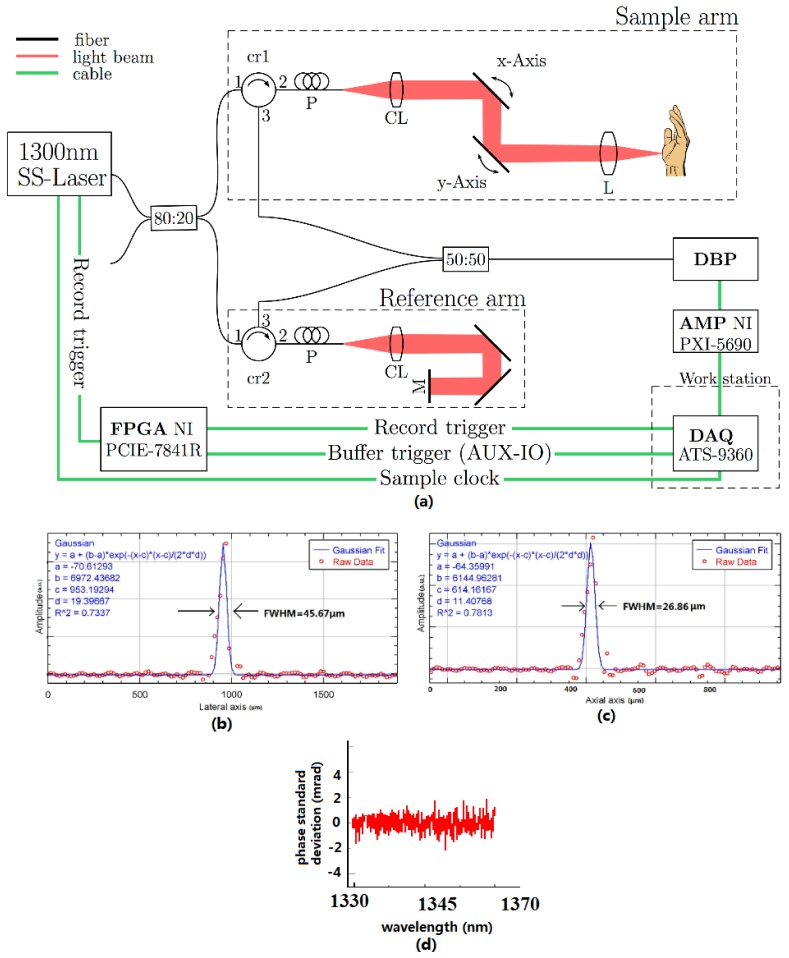
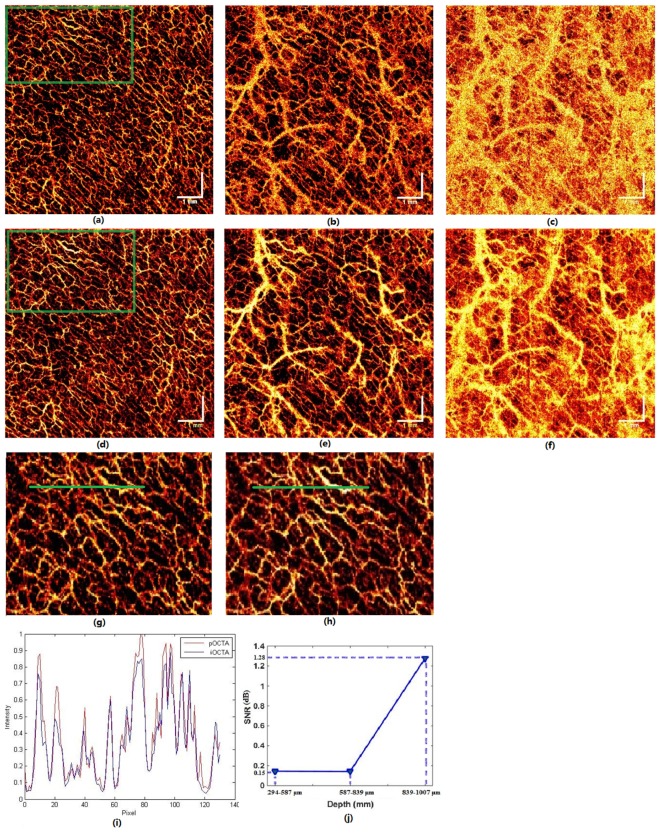
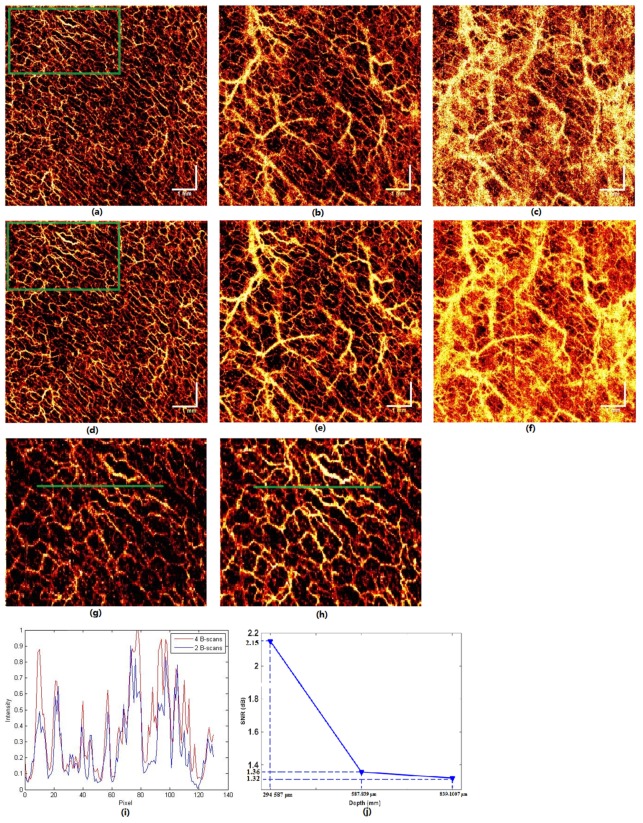
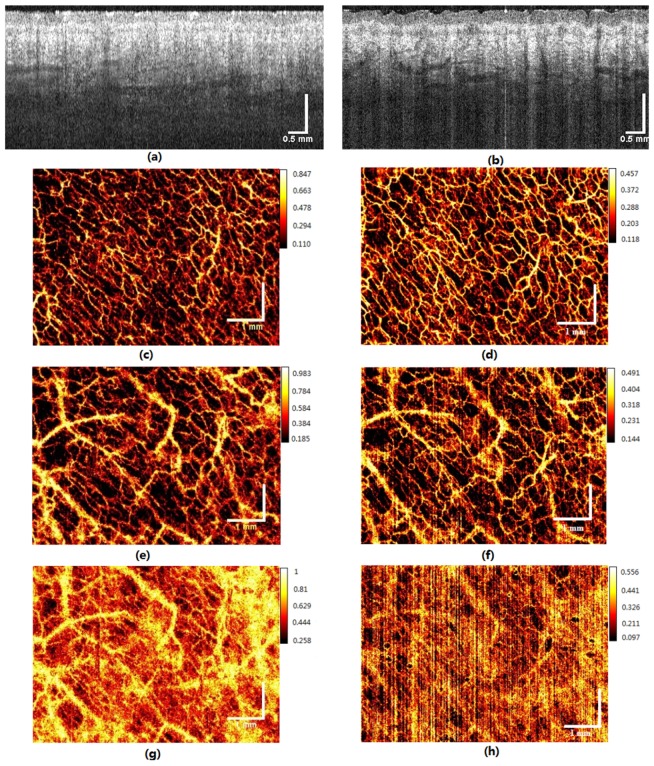
We demonstrate noninvasive structural and microvascular contrast imaging of human skin in vivo, using phase difference swept source OCT angiography (pOCTA). The pOCTA system employs an akinetic, all-semiconductor, highly phase-stable swept laser source which operates at 1340 nm central wavelength, with 37 nm bandwidth (at 0 dB region) and 200 kHz A-scan rate. The phase sensitive detection does not need any external phase stabilizing implementations, due to the outstanding high phase linearity and sweep phase repeatability within 2 mrad. We compare the performance of phase based OCTA to speckle based OCTA for visualizing human vascular networks. pOCTA shows better contrast especially for deeper vascular details as compared to speckle based OCTA. The phase stability of the akinetic source allows the OCTA system to show decent vascular contrast only with 2 B-scans. We compare the performance of using 2 versus 4 B-scans for calculating the vascular contrast. Finally, the performance of a 100 nm bandwidth akinetic laser at 1310 nm is investigated for both OCT and OCTA.
Keywords: (140.3600) Lasers, tunable; (170.0110) Imaging systems; (170.3880) Medical and biological imaging; (170.4500) Optical coherence tomography; (170.4580) Optical diagnostics for medicine.
Figures
Similar articles
-
Phase stable swept-source optical coherence tomography with active mode-locking laser for contrast enhancements of retinal angiography.Sci Rep. 2021 Aug 17;11(1):16636. doi: 10.1038/s41598-021-95982-9. Sci Rep. 2021. PMID: 34404853 Free PMC article.
-
Akinetic all-semiconductor programmable swept-source at 1550 nm and 1310 nm with centimeters coherence length.Opt Express. 2014 Feb 10;22(3):2632-55. doi: 10.1364/OE.22.002632. Opt Express. 2014. PMID: 24663556
-
Wide field and highly sensitive angiography based on optical coherence tomography with akinetic swept source.Biomed Opt Express. 2016 Dec 22;8(1):420-435. doi: 10.1364/BOE.8.000420. eCollection 2017 Jan 1. Biomed Opt Express. 2016. PMID: 28101428 Free PMC article.
-
Swept-Source Optical Coherence Tomography Angio™ (Topcon Corp, Japan): Technology Review.Dev Ophthalmol. 2016;56:13-7. doi: 10.1159/000442771. Epub 2016 Mar 15. Dev Ophthalmol. 2016. PMID: 27023108 Review.
-
Clinical utility of anterior segment swept-source optical coherence tomography in glaucoma.Oman J Ophthalmol. 2016 Jan-Apr;9(1):3-10. doi: 10.4103/0974-620X.176093. Oman J Ophthalmol. 2016. PMID: 27013821 Free PMC article. Review.
Cited by
-
Phase-stability optimization of swept-source optical coherence tomography.Biomed Opt Express. 2018 Oct 9;9(11):5280-5295. doi: 10.1364/BOE.9.005280. eCollection 2018 Nov 1. Biomed Opt Express. 2018. PMID: 30460128 Free PMC article.
-
En face optical coherence tomography: a technology review [Invited].Biomed Opt Express. 2019 Apr 3;10(5):2177-2201. doi: 10.1364/BOE.10.002177. eCollection 2019 May 1. Biomed Opt Express. 2019. PMID: 31143489 Free PMC article.
-
Phase stable swept-source optical coherence tomography with active mode-locking laser for contrast enhancements of retinal angiography.Sci Rep. 2021 Aug 17;11(1):16636. doi: 10.1038/s41598-021-95982-9. Sci Rep. 2021. PMID: 34404853 Free PMC article.
-
Highly phase-stable 200 kHz swept-source optical coherence tomography based on KTN electro-optic deflector.Biomed Opt Express. 2017 Jul 18;8(8):3687-3699. doi: 10.1364/BOE.8.003687. eCollection 2017 Aug 1. Biomed Opt Express. 2017. PMID: 29082103 Free PMC article.
-
Compact akinetic swept source optical coherence tomography angiography at 1060 nm supporting a wide field of view and adaptive optics imaging modes of the posterior eye.Biomed Opt Express. 2018 Mar 26;9(4):1871-1892. doi: 10.1364/BOE.9.001871. eCollection 2018 Apr 1. Biomed Opt Express. 2018. PMID: 29675326 Free PMC article.
References
-
- W. Drexler and J. G. Fujimoto, “Optical Coherence Tomography -Technology and Applications. 2 ed,” Switzerland: Springer International Publishing; 2015.
LinkOut - more resources
Full Text Sources
Other Literature Sources
Miscellaneous