

Optical Coherence Tomography Angiography in Mice: Comparison with Confocal Scanning Laser Microscopy and Fluorescein Angiography
- PMID: 27570710
- PMCID: PMC4997887
- DOI: 10.1167/tvst.5.4.11
Optical Coherence Tomography Angiography in Mice: Comparison with Confocal Scanning Laser Microscopy and Fluorescein Angiography
Abstract
Purpose: Optical coherence tomography angiography (OCT-A) allows noninvasive visualization of retinal vessels in vivo. OCT-A was used to characterize the vascular network of the mouse retina and was compared with fluorescein angiography (FA) and histology.
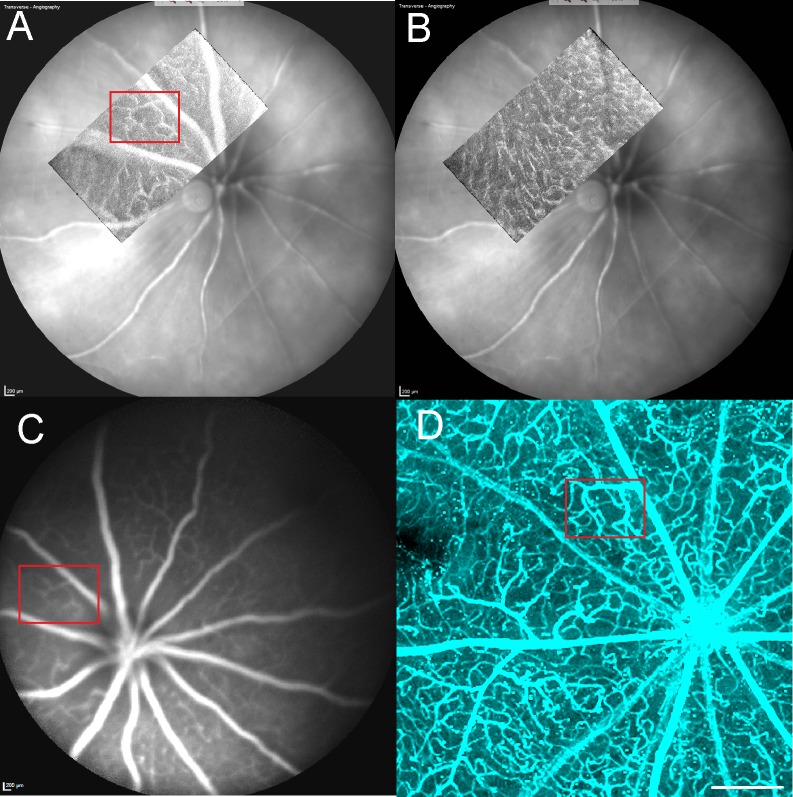
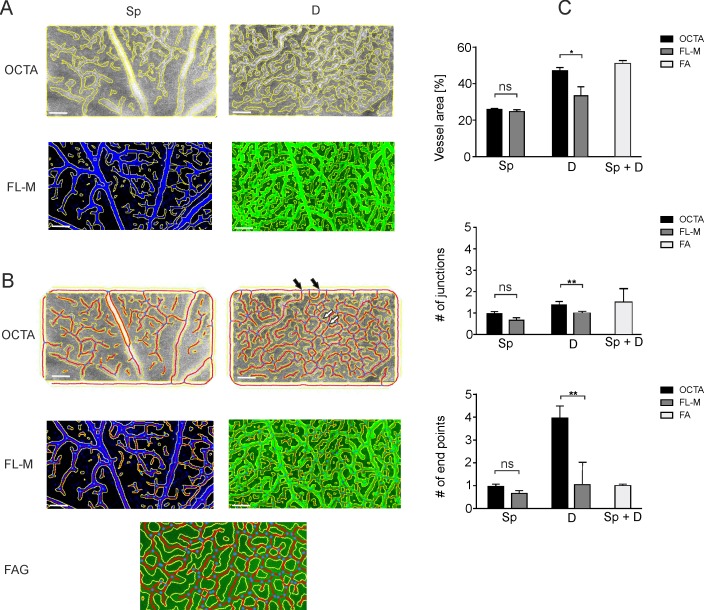
Methods: In the present study, OCT-A based on a Heidelberg Engineering Spectralis system was used to investigate the vascular network in mice. Data was compared with FA and confocal microscopy of flat-mount histology stained with isolectin IB4. For quantitative analysis the National Cancer Institute's AngioTool software was used. Vessel density, the number of vessel junctions, and endpoints were measured and compared between the imaging modalities.
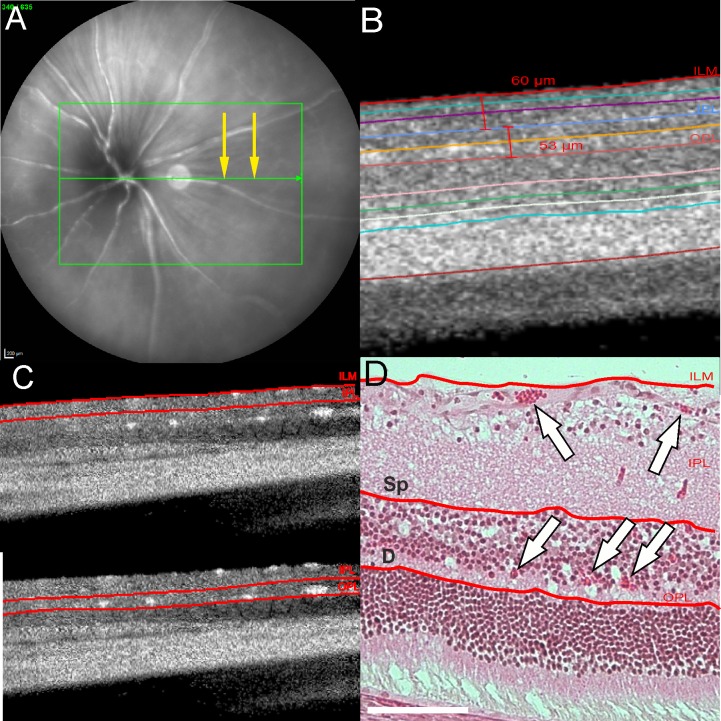
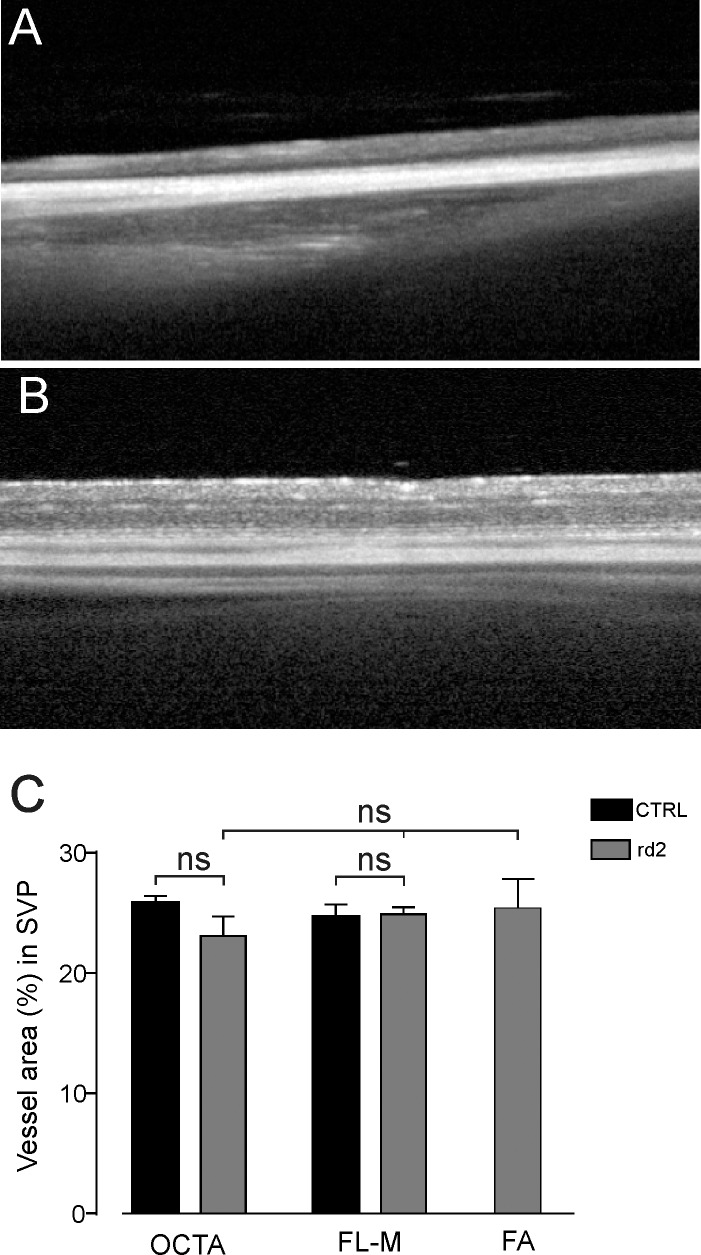
Results: The configuration of the superficial capillary network was comparable with OCT-A and flat-mount histology in BALBc mice. However, vessel density and the number of vessel junctions per region of interest (P = 0.0161 and P = 0.0015, respectively) in the deep vascular network of BALBc mice measured by OCT-A was significantly higher than with flat-mount histology. In C3A.Cg-Pde6b+Prph2Rd2/J mice, where the deep capillary plexus is absent, analysis of the superficial network provided similar results for all three imaging modalities.
Conclusion: OCT-A is a helpful imaging tool for noninvasive, in vivo imaging of the vascular plexus in mice. It may offer advantages over FA and confocal microscopy especially for imaging the deep vascular plexus.
Translational relevance: The present study shows that OCT-A can be employed for small animal imaging to assess the vascular network and offers advantages over flat-mount histology and FA.
Keywords: confocal microscopy; confocal scanning microscopy; fluorescein angiography; optical coherence angiography; retinal vasculature.
Figures
Similar articles
-
Optical coherence tomography angiography (OCT-A) in an animal model of laser-induced choroidal neovascularization.Exp Eye Res. 2019 Jul;184:162-171. doi: 10.1016/j.exer.2019.04.002. Epub 2019 Apr 16. Exp Eye Res. 2019. PMID: 31002822
-
Angiography reveals novel features of the retinal vasculature in healthy and diabetic mice.Exp Eye Res. 2015 Sep;138:6-21. doi: 10.1016/j.exer.2015.06.023. Epub 2015 Jun 26. Exp Eye Res. 2015. PMID: 26122048
-
Colocalization of optical coherence tomography angiography with histology in the mouse retina.Microvasc Res. 2020 Nov;132:104055. doi: 10.1016/j.mvr.2020.104055. Epub 2020 Aug 8. Microvasc Res. 2020. PMID: 32777249
-
[Novel Examination Procedures for the Assessment of Retinal Artery Occlusion by OCT Angiography].Klin Monbl Augenheilkd. 2017 Sep;234(9):1154-1160. doi: 10.1055/s-0043-118224. Epub 2017 Sep 11. Klin Monbl Augenheilkd. 2017. PMID: 28895629 Review. German.
-
ZEISS Angioplex™ Spectral Domain Optical Coherence Tomography Angiography: Technical Aspects.Dev Ophthalmol. 2016;56:18-29. doi: 10.1159/000442773. Epub 2016 Mar 15. Dev Ophthalmol. 2016. PMID: 27023249 Review.
Cited by
-
Intravitreal AAV2.COMP-Ang1 Attenuates Deep Capillary Plexus Expansion in the Aged Diabetic Mouse Retina.Invest Ophthalmol Vis Sci. 2019 Jun 3;60(7):2494-2502. doi: 10.1167/iovs.18-26182. Invest Ophthalmol Vis Sci. 2019. PMID: 31185088 Free PMC article.
-
Retinal ganglion cell ablation in guinea pigs.Exp Eye Res. 2021 Jan;202:108339. doi: 10.1016/j.exer.2020.108339. Epub 2020 Oct 27. Exp Eye Res. 2021. PMID: 33127343 Free PMC article.
-
Comparative Optical Coherence Tomography Angiography of Wild-Type and rd10 Mouse Retinas.Transl Vis Sci Technol. 2018 Dec 28;7(6):42. doi: 10.1167/tvst.7.6.42. eCollection 2018 Nov. Transl Vis Sci Technol. 2018. PMID: 30619662 Free PMC article.
-
OCT-Angiography for Non-Invasive Monitoring of Neuronal and Vascular Structure in Mouse Retina: Implication for Characterization of Retinal Neurovascular Coupling.EC Ophthalmol. 2017;5(3):89-98. Epub 2017 Feb 21. EC Ophthalmol. 2017. PMID: 29333536 Free PMC article.
-
Morphological and vascular characteristics of the optic nerve head of normal guinea pigs.Sci Rep. 2022 Jan 18;12(1):873. doi: 10.1038/s41598-022-04911-x. Sci Rep. 2022. PMID: 35042920 Free PMC article.
References
-
- Ebneter A,, Wolf S,, Abhishek J,, Zinkernagel MS. Retinal layer response to ranibizumab during treatment of diabetic macular edema: thinner is not always better. Retina. 2016; 36: 1314–1323. - PubMed
-
- Smith LE,, Wesolowski E,, McLellan A,, et al. Oxygen-induced retinopathy in the mouse. Invest Ophthalmol Vis Sci. 1994; 35: 101–111. - PubMed
-
- Kim KH,, Puoris'haag M,, Maguluri GN,, et al. Monitoring mouse retinal degeneration with high-resolution spectral-domain optical coherence tomography. J Vis. 2008; 8: 17.1–11. - PubMed
LinkOut - more resources
Full Text Sources
Other Literature Sources
