. 2016 Jul 28;3(4):ENEURO.0045-16.2016.
doi: 10.1523/ENEURO.0045-16.2016. eCollection 2016 Jul-Aug.

Differential Contributions of Olfactory Receptor Neurons in a Drosophila Olfactory Circuit

Affiliations

Differential Contributions of Olfactory Receptor Neurons in a Drosophila Olfactory Circuit

Gunnar Newquist et al. eNeuro. .

Abstract

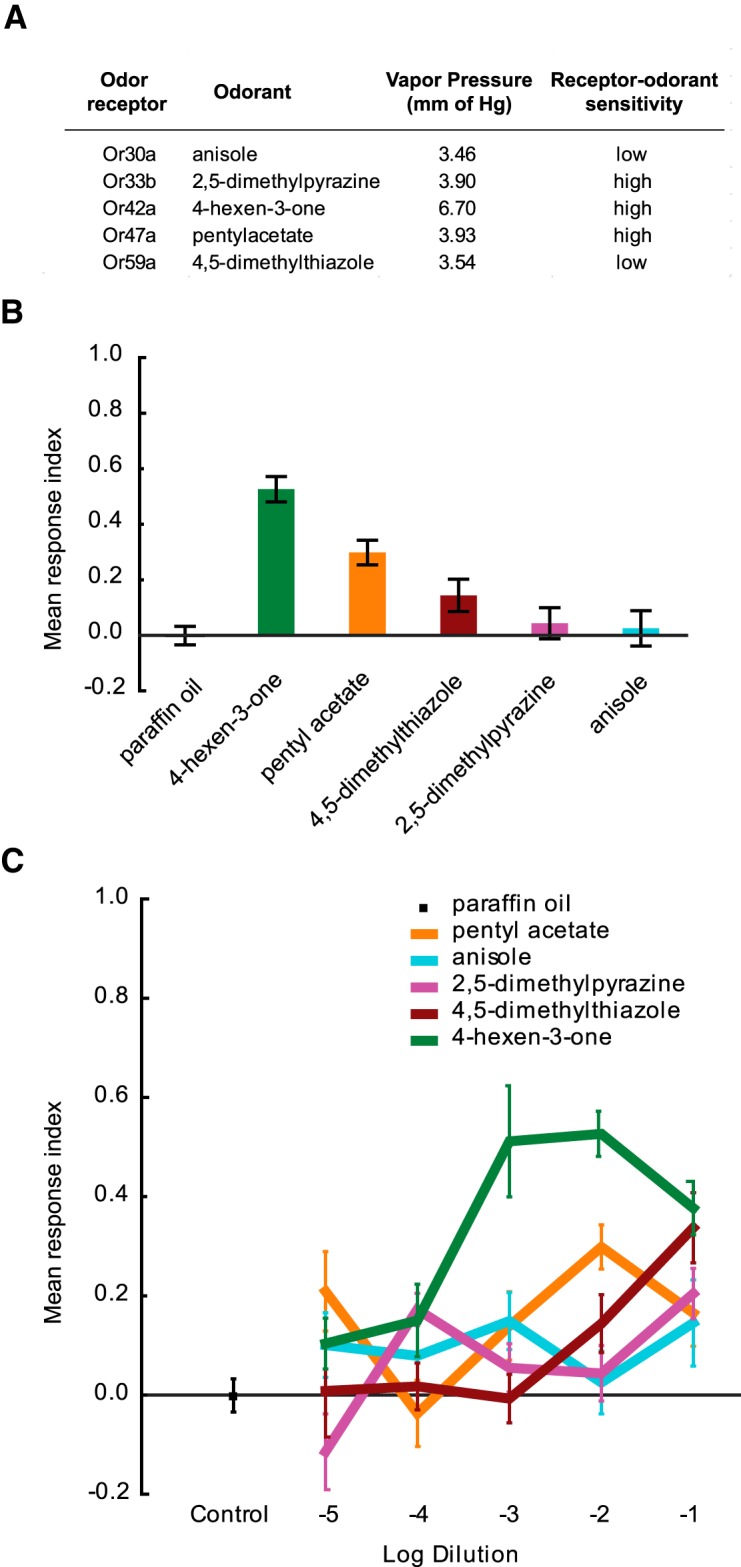
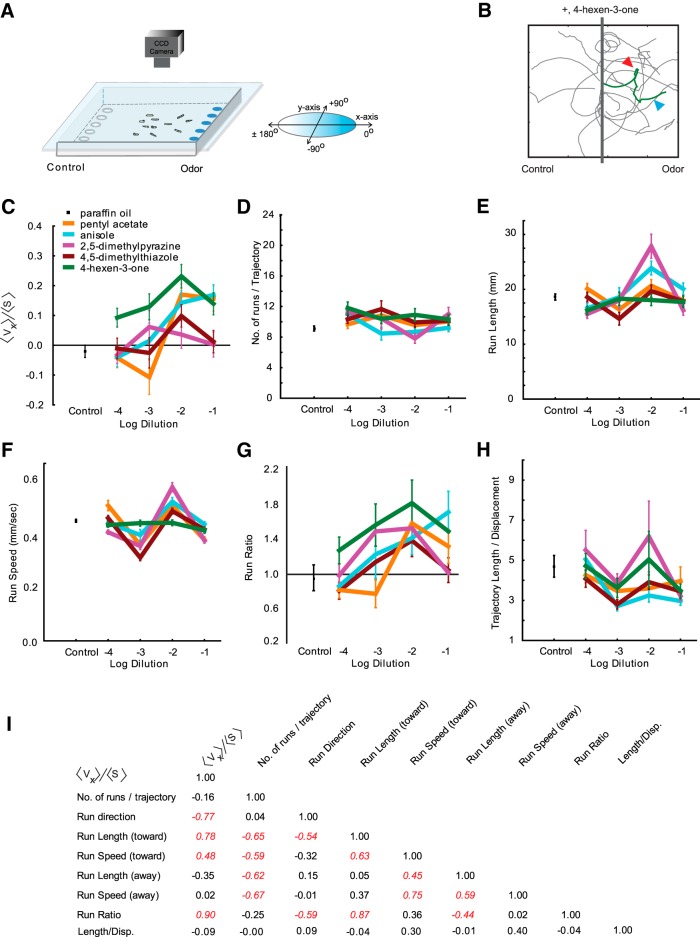
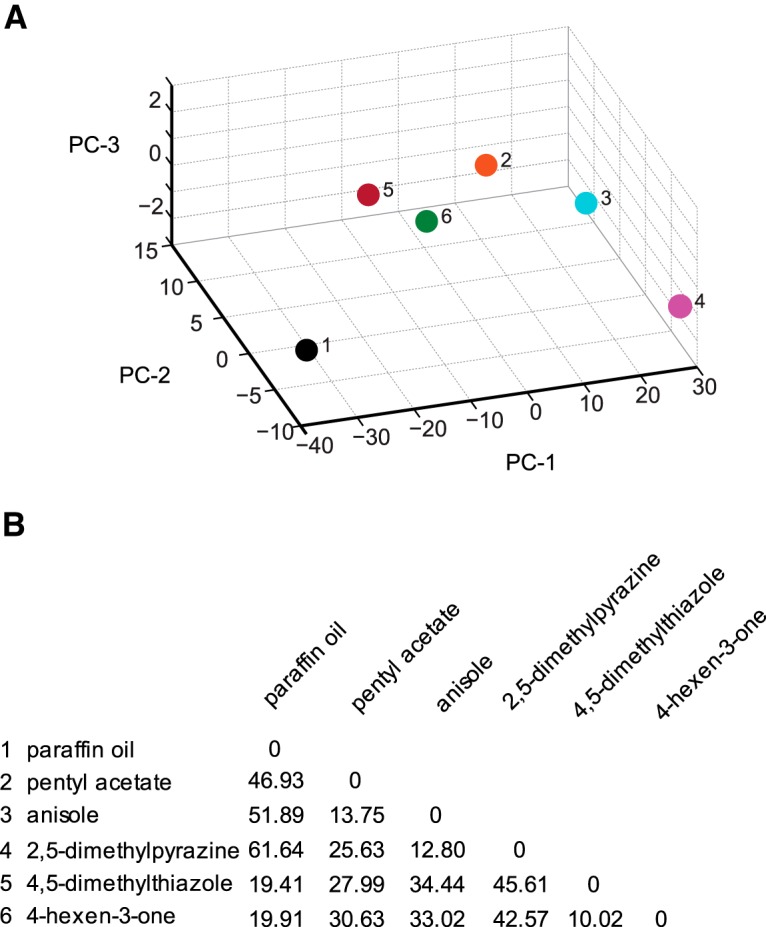
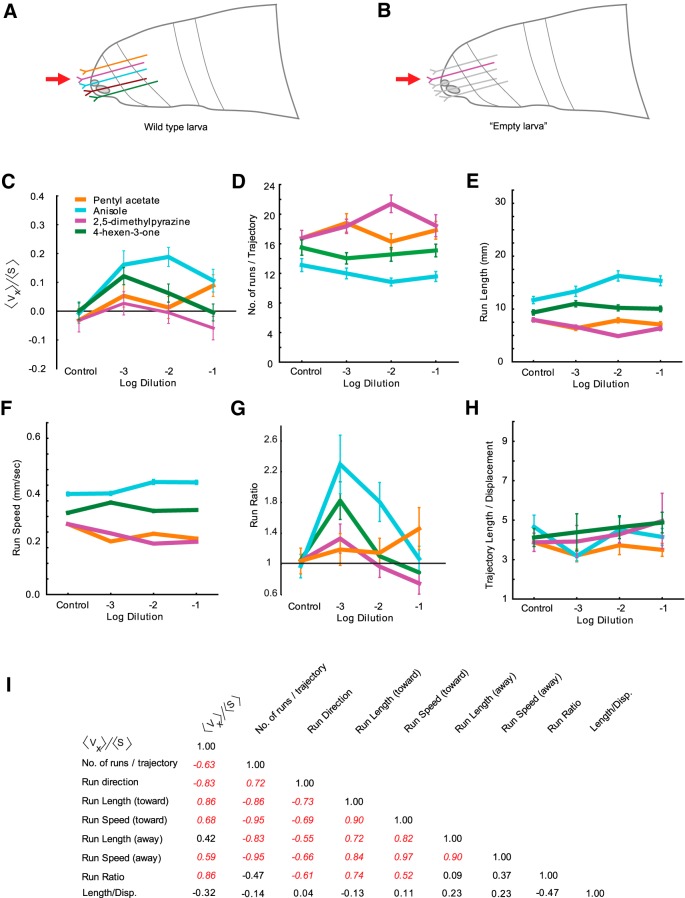
The ability of an animal to detect, discriminate, and respond to odors depends on the functions of its olfactory receptor neurons (ORNs). The extent to which each ORN, upon activation, contributes to chemotaxis is not well understood. We hypothesized that strong activation of each ORN elicits a different behavioral response in the Drosophila melanogaster larva by differentially affecting the composition of its navigational behavior. To test this hypothesis, we exposed Drosophila larvae to specific odorants to analyze the effect of individual ORN activity on chemotaxis. We used two different behavioral paradigms to analyze the chemotaxis response of larvae to odorants. When tested with five different odorants that elicit strong physiological responses from single ORNs, larval behavioral responses toward each odorant differed in the strength of attraction as well as in the composition of discrete navigational elements, such as runs and turns. Further, behavioral responses to odorants did not correlate with either the strength of odor gradients tested or the sensitivity of each ORN to its cognate odorant. Finally, we provide evidence that wild-type larvae with all ORNs intact exhibit higher behavioral variance than mutant larvae that have only a single pair of functional ORNs. We conclude that individual ORNs contribute differently to the olfactory circuit that instructs chemotactic responses. Our results, along with recent studies from other groups, suggest that ORNs are functionally nonequivalent units. These results have implications for understanding peripheral odor coding.

Keywords: Drosophila; behavior; larva; odor receptor; olfaction; receptor neuron.


Figures

Fig. 1.
Fig. 1.
Drosophila melanogaster larvae respond differently to odorants activating individual ORNs in a two-choice small-format paradigm. A, Five odorants selected for this study are shown. Listed next to each odorant is the odor receptor that it activates, its vapor pressure measured in millimeters of mercury at 25°C, and the sensitivity of each odor receptor to its cognate odorant determined in an electrophysiology assay (Mathew et al., 2013). B, Mean RIs of wild-type Drosophila larvae tested in the presence of odorants in a two-choice behavior paradigm are shown. Odorants were tested at a 10−2 dilution. Each bar represents the RI ± SEM (n = 8). Responses differ; for example, the response to anisole differs from the responses to 4-hexen-3-one and pentyl acetate (Tukey’s HSD within a one-way ANOVA, p < 0.001). C, Dose–response analysis for each odorant in the two-choice behavior paradigm. Odorants were tested at five different dilutions (10−1, 10−2, 10−3, 10−4, and 10−5). Each data point represents the RI ± SEM (n = 8).
Fig. 2.
Fig. 2.
Navigational analysis of wild-type D. melanogaster larvae. A, Paradigm containing a 22 × 22 cm2 agarose Petri plate. Odorant is placed on discs at the right; paraffin oil diluent alone is placed on discs to the left. The chamber is sealed by placing a clear glass plate over the arena. Third-instar larvae are placed in the center. The movement of larvae is recorded with a CCD camera. B, Sample trajectories of wild-type larvae in response to 4-hexen-3-one (10−2 dilution). The gray bar along the y-axis indicates the starting position of larvae. A “stop” (red arrowhead) is defined by a 45° or greater change in trajectory angle. A “run” (blue arrowhead) is defined as the length of trajectory between two stops. Runs are quantified in terms of length, speed, and direction. C–H, Dose–response analysis of six navigational parameters for each odorant in the navigational assay. Odorants were tested at four different dilutions (10−1, 10−2, 10−3, 10−4), which are depicted on the x-axis of each graph. The y-axes in each graph are as follows: navigational indices (<vx>/<s>) of larvae to indicated dilutions of five odorants and paraffin oil (C); the mean number of runs per trajectory (D); the mean length of runs in millimeters (E); the mean speed of runs in millimeters per second (F); the ratio of mean run lengths in the direction of odorant (all runs that oriented between +45° and −45°) to mean run lengths away from odorant (all runs that oriented between +135° to −135°; G); and the mean length/displacement defined as total length of each trajectory is divided by the total displacement of each trajectory (H). Each data point represents the mean ± SEM (n = 8 assays, ∼100–120 trajectories analyzed for each condition). I, Correlation matrix displaying r 2 values among various behavioral parameters tested. Values italicized and in red are statistically significant (p < 0.05).
Fig. 3.
Fig. 3.
Principal component analysis of wild-type behavior responses. A, The five ORN activators (colored circles) and paraffin oil (dark circle) are mapped in a behavior space. Canton S (wild-type) larvae were tested against each odorant. Shown are the first three principal components (PCs) of a multidimensional behavior space made up of nine navigational descriptors measured at 10−2 concentration of odorants (RI, number of runs per trajectory, run length (toward), run length (away), run speed (toward), run speed (away), run ratio, run direction, and length/displacement). Navigational descriptors were normalized. Variances explained by PC1, PC2, and PC3 are 91.3%, 8.1%, and 0.6%, respectively. B, Euclidean distances between individual combinations of odorants in the behavior space.
Fig. 4.
Fig. 4.
Navigational analysis of larvae expressing a single pair of functional neurons. A, B, Cartoons depicting a wild-type larva (A), in which all first-order sensory neurons are functional and an empty larva (B), in which only one pair of sensory neurons is functional. C–H, Dose–response analysis of six navigational parameters for each odorant in the navigational assay. Odorants were tested at three different dilutions (10−1, 10−2, 10−3) depicted on the x-axis on each graph. The y-axes in each graph are as follows: navigational indices (<vx>/<s>) of larvae measured in response to indicated dilutions of four odorants and paraffin oil (C); the mean number of runs per trajectory (D); the mean length of runs in millimeters (E); the mean speed of runs in millimeters per seconds (F); the ratio of mean run lengths in the direction of odorant (all runs that oriented between +45° and −45°) to mean run lengths away from odorant (all runs that oriented between +135° and −135°; G); and the mean length/displacement, defined as the total length of each trajectory divided by the total displacement of each trajectory (H). Each data point represents mean ± SEM (n = 8 assays, ∼100–120 trajectories analyzed for each condition). I, Correlation matrix displaying r 2 values among various behavioral parameters tested. Values italicized and in red are statistically significant (p < 0.05).
Fig. 5.
Fig. 5.
Principal component analysis of empty larval behavior responses. A, The four ORN activators (colored circles) and paraffin oil (dark circles) are mapped in a behavior space. Each circle represents a different OrX-empty larva (el) genotype, odorant combination. Three dark circles (1–3) account for the control responses of each of the three genotypes used in this experiment. Shown are the first three principal components (PCs) of a multidimensional behavior space made up of nine navigational descriptors measured at a 10−2 concentration of odorants (RI, number of runs per trajectory, run length (toward), run length (away), run speed (toward), run speed (away), run ratio, run direction, and length/displacement). Navigational descriptors were normalized. The variances explained by PC1, PC2, and PC3 are 85.1%, 12.9%, and 1.5%, respectively. B, Euclidean distances between individual combinations of odorants in the behavior space.
Fig. 6.
Fig. 6.
Comparisons of strength and variability of behavior responses among wild-type and empty larva genotypes. A, B, Heat map comparisons of statistical difference between the means of navigational parameters in response to odorants and in response to control diluent in wild-type larvae (A) and empty larvae (B). Six navigational parameters at three different dilutions (10−1, 10−2, and 10−3) of each odorant were analyzed. Five odorants were analyzed for wild-type larvae, and four odorants were analyzed for the three empty larvae genotypes. An arbitrary color code was assigned to visualize the statistical difference: red indicates an increase from control levels; and blue indicates a decrease from control levels. Lighter to darker shades of each color are based on an increasing level of significance. For all navigational parameters except run ratio, statistical significance was determined using one-way ANOVA followed by a Tukey’s post hoc HSD test. For run ratio, statistical significance was calculated with a χ2 test followed by a Bonferroni correction. C, Mean SDs for five different behavioral parameters compared for wild-type larvae (green) and empty larvae (orange). Behavior values elicited by four odorants were used for this analysis. Each bar represents the scaled mean ± SEM. Wild-type larvae show higher variance in three of the five behavioral measures compared with empty larvae (Student’s t test followed by Bonferroni correction, p < 0.01).

Similar articles

Cited by

References

    1. Andersson MN, Schlyter F, Hill SR, Dekker T (2012) What reaches the antenna? How to calibrate odor flux and ligand-receptor affinities. Chem Senses 37:403–420. - PubMed
    1. Benton R, Sachse S, Michnick SW, Vosshall LB (2006) Atypical membrane topology and heteromeric function of Drosophila odorant receptors in vivo. PLoS Biol 4:e20. 10.1371/journal.pbio.0040020 - DOI - PMC - PubMed
    1. Couto A, Alenius M, Dickson B (2005) Molecular, anatomical, and functional organization of the Drosophila olfactory system. Curr Biol 15:1535–1547. 10.1016/j.cub.2005.07.034 - DOI - PubMed
    1. Fernández-Grandon GM, Gezan SA, Armour JA, Pickett JA, Logan JG (2015) Heritability of attractiveness to mosquitoes. PLoS One 10:e0122716. 10.1371/journal.pone.0122716 - DOI - PMC - PubMed
    1. Fishilevich E, Vosshall LB (2005) Genetic and functional subdivision of the Drosophila antennal lobe. Curr Biol 15:1548–1553. 10.1016/j.cub.2005.07.066 - DOI - PubMed

Publication types

LinkOut - more resources