

Imaging Renal Urea Handling in Rats at Millimeter Resolution using Hyperpolarized Magnetic Resonance Relaxometry
- PMID: 27570835
- PMCID: PMC4996281
- DOI: 10.18383/j.tom.2016.00127
Imaging Renal Urea Handling in Rats at Millimeter Resolution using Hyperpolarized Magnetic Resonance Relaxometry
Abstract
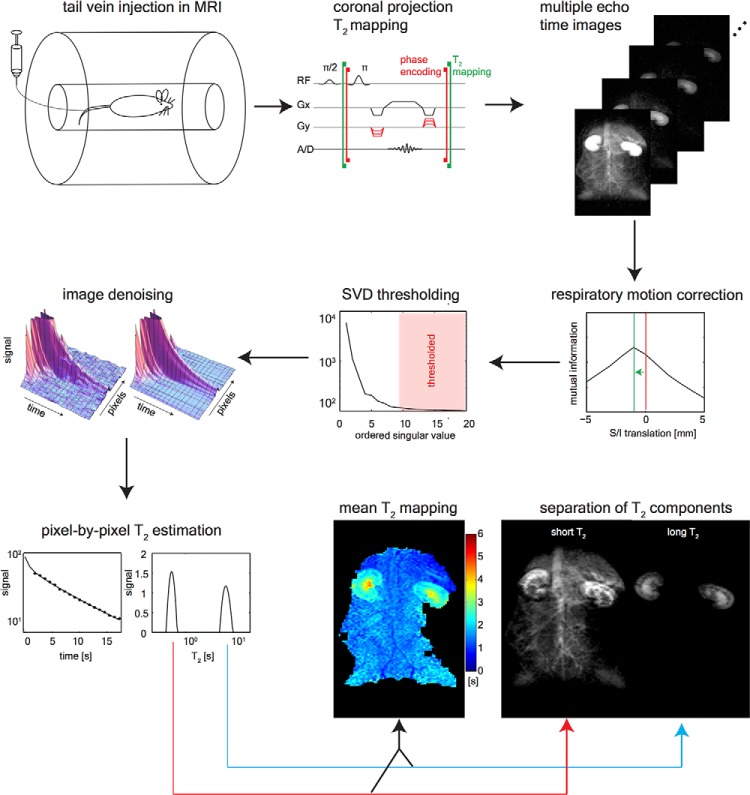
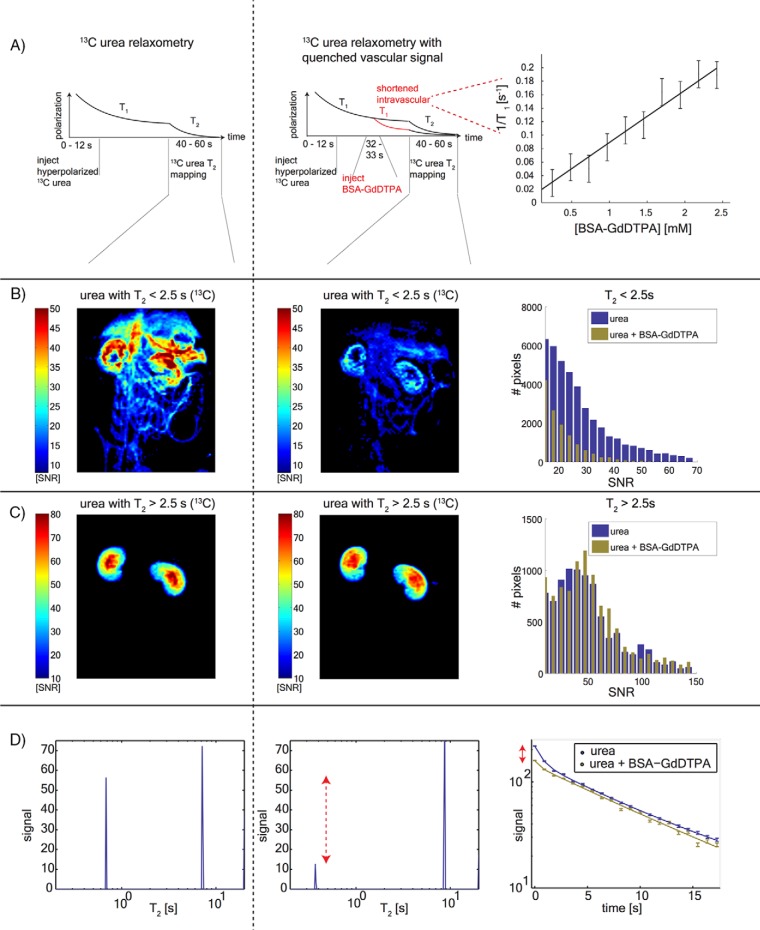
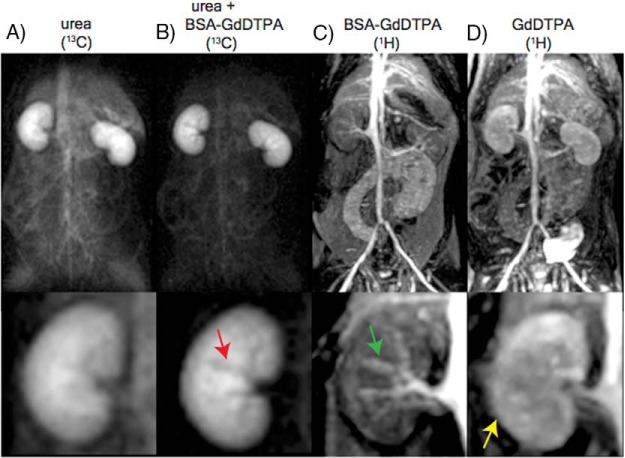
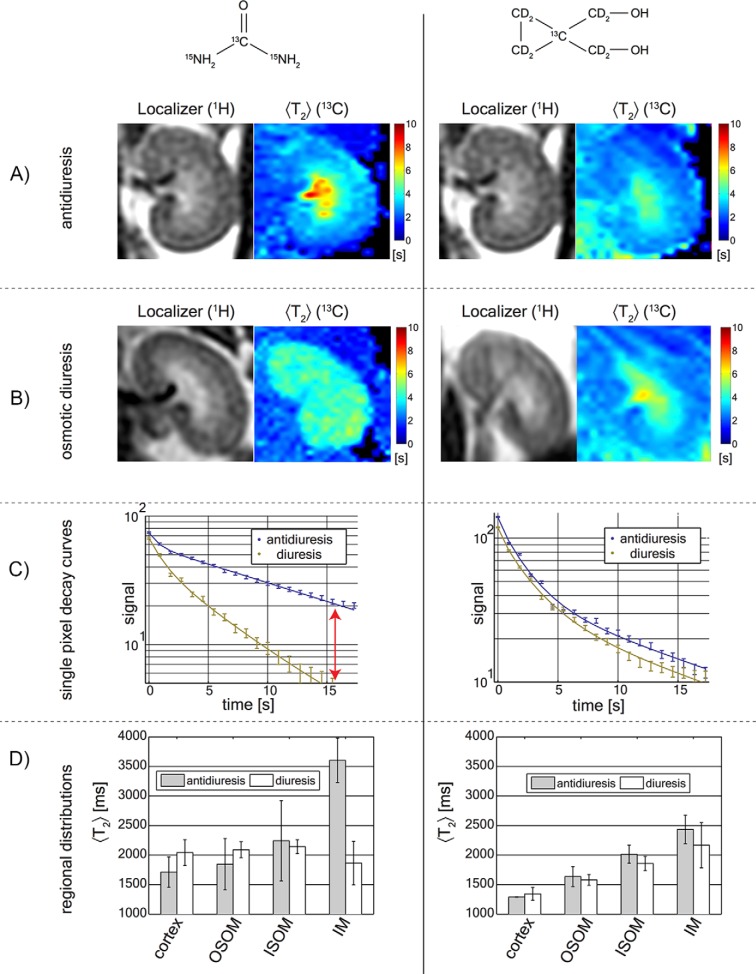
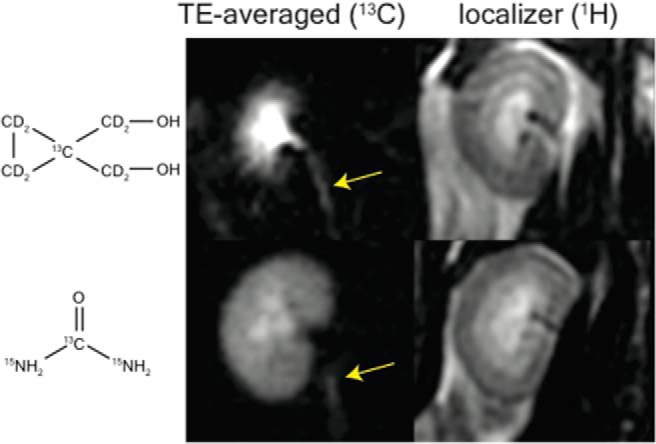
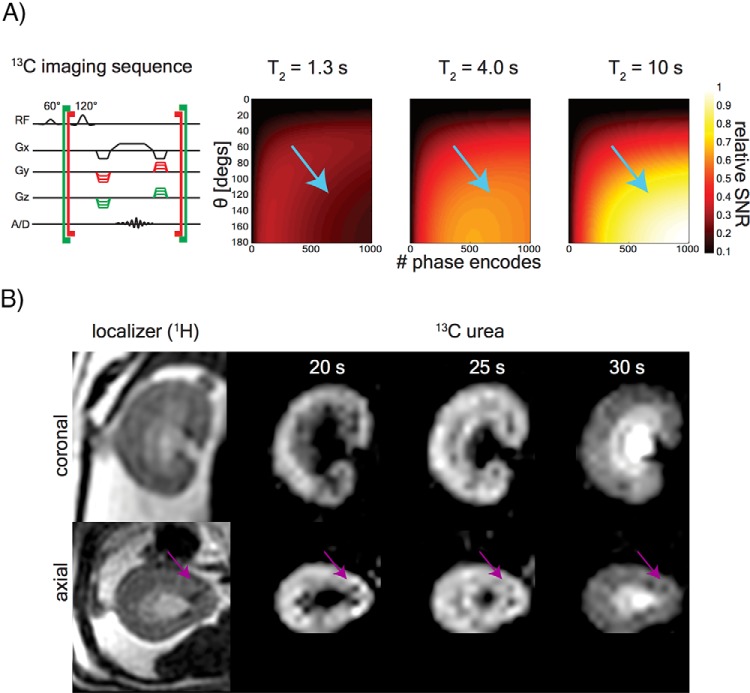
In vivo spin spin relaxation time (T2) heterogeneity of hyperpolarized [13C,15N2]urea in the rat kidney was investigated. Selective quenching of the vascular hyperpolarized 13C signal with a macromolecular relaxation agent revealed that a long-T2 component of the [13C,15N2]urea signal originated from the renal extravascular space, thus allowing the vascular and renal filtrate contrast agent pools of the [13C,15N2]urea to be distinguished via multi-exponential analysis. The T2 response to induced diuresis and antidiuresis was performed with two imaging agents: hyperpolarized [13C,15N2]urea and a control agent hyperpolarized bis-1,1-(hydroxymethyl)-1-13C-cyclopropane-2H8. Large T2 increases in the inner-medullar and papilla were observed with the former agent and not the latter during antidiuresis. Therefore, [13C,15N2]urea relaxometry is sensitive to two steps of the renal urea handling process: glomerular filtration and the inner-medullary urea transporter (UT)-A1 and UT-A3 mediated urea concentrating process. Simple motion correction and subspace denoising algorithms are presented to aid in the multi exponential data analysis. Furthermore, a T2-edited, ultra long echo time sequence was developed for sub-2 mm3 resolution 3D encoding of urea by exploiting relaxation differences in the vascular and filtrate pools.
Conflict of interest statement
Conflict of Interest: None reported.
Figures
Similar articles
-
High resolution (13)C MRI with hyperpolarized urea: in vivo T(2) mapping and (15)N labeling effects.IEEE Trans Med Imaging. 2014 Feb;33(2):362-71. doi: 10.1109/TMI.2013.2285120. Epub 2013 Oct 25. IEEE Trans Med Imaging. 2014. PMID: 24235273 Free PMC article.
-
Monitoring urea transport in rat kidney in vivo using hyperpolarized ¹³C magnetic resonance imaging.Am J Physiol Renal Physiol. 2012 Jun 15;302(12):F1658-62. doi: 10.1152/ajprenal.00640.2011. Epub 2012 Apr 4. Am J Physiol Renal Physiol. 2012. PMID: 22492940 Free PMC article.
-
Hyperpolarized 13 C,15 N2 -urea T2 relaxation changes in acute kidney injury.Magn Reson Med. 2018 Aug;80(2):696-702. doi: 10.1002/mrm.27050. Epub 2017 Dec 28. Magn Reson Med. 2018. PMID: 29285782
-
Regulation of urea transporter proteins in kidney and liver.Mt Sinai J Med. 2000 Mar;67(2):112-9. Mt Sinai J Med. 2000. PMID: 10747366 Review.
-
Urea transport in the kidney.Compr Physiol. 2011 Apr;1(2):699-729. doi: 10.1002/cphy.c100030. Compr Physiol. 2011. PMID: 23737200 Review.
Cited by
-
Hyperpolarized [1-13C]-acetate Renal Metabolic Clearance Rate Mapping.Sci Rep. 2017 Nov 22;7(1):16002. doi: 10.1038/s41598-017-15929-x. Sci Rep. 2017. PMID: 29167446 Free PMC article.
-
Development of high resolution 3D hyperpolarized carbon-13 MR molecular imaging techniques.Magn Reson Imaging. 2017 May;38:152-162. doi: 10.1016/j.mri.2017.01.003. Epub 2017 Jan 7. Magn Reson Imaging. 2017. PMID: 28077268 Free PMC article.
-
A metabolite specific 3D stack-of-spirals bSSFP sequence for improved bicarbonate imaging in hyperpolarized [1-13C]Pyruvate MRI.J Magn Reson. 2023 Aug;353:107518. doi: 10.1016/j.jmr.2023.107518. Epub 2023 Jun 26. J Magn Reson. 2023. PMID: 37402333 Free PMC article.
-
Hyperpolarized Carbon (13C) MRI of the Kidney: Experimental Protocol.Methods Mol Biol. 2021;2216:481-493. doi: 10.1007/978-1-0716-0978-1_29. Methods Mol Biol. 2021. PMID: 33476019 Free PMC article.
-
15 N-carnitine, a novel endogenous hyperpolarized MRI probe with long signal lifetime.Magn Reson Med. 2021 Apr;85(4):1814-1820. doi: 10.1002/mrm.28578. Epub 2020 Nov 12. Magn Reson Med. 2021. PMID: 33179825 Free PMC article.
References
-
- Guyton AC. Renal Regulation of Blood Volume and Extracellular Fluid Volume: Excretion and Regulation of Urea, Potassium, and Other Substances. Textbook of Medical Physiology, Eighth Edition Philadelphia: W. B. Saunders Company; 1991.
-
- Marsh DJ, Knepper MA. Renal handling of urea. Compr Physiol. 2011;p.1317–1347. - PubMed
-
- Bankir L, Yang B. New insights into urea and glucose handling by the kidney, and the urine concentrating mechanism. Kidney Int. 2012;81:1179–1198. - PubMed
-
- Fenton RA, Knepper MA. Urea and renal function in the 21st century: insights from knockout mice. J Am Soc Nephrol. 2007;18:679–688. - PubMed
-
- Sands JM. Regulation of renal urea transporters. J Am Soc Nephrol. 1999;10:635–646. - PubMed
Grants and funding
LinkOut - more resources
Full Text Sources
Other Literature Sources
Miscellaneous