. 2017 May 1;525(7):1532-1557.
doi: 10.1002/cne.24107. Epub 2016 Dec 7.

Cone signals in monostratified and bistratified amacrine cells of adult zebrafish retina

Affiliations

Cone signals in monostratified and bistratified amacrine cells of adult zebrafish retina

M M Torvund et al. J Comp Neurol. .

Erratum in

Abstract

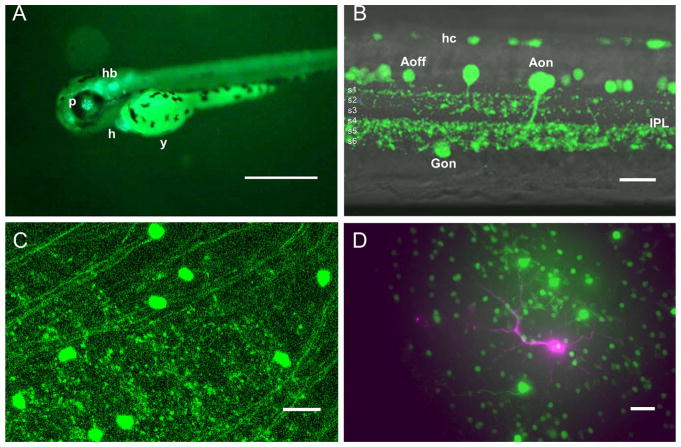
Strata within the inner plexiform layer (IPL) of vertebrate retinas are suspected to be distinct signaling regions. Functions performed within adult zebrafish IPL strata were examined through microelectrode recording and staining of stratified amacrine types. The stimulus protocol and analysis discriminated the pattern of input from red, green, blue, and UV cones as well as the light-response waveforms in this tetrachromatic species. A total of 36 cells were analyzed. Transient depolarizing waveforms at ON and OFF originated with bistratified amacrine types, whose dendritic planes branched either in IPL sublaminas a & b, or only within sublamina a. Monophasic-sustained depolarizing waveforms originated with types monostratified in IPL s4 (sublamina b). OFF responses hyperpolarized at onset, depolarized at offset, and in some cases depolarized during mid-stimulus. These signals originated with types monostratified in s1 or s2 (sublamina a). Bistratified amacrines received depolarizing signals only from red cones, at both ON and OFF, while s4 stratified ON cells combined red and green cone signals. The s1/s2 stratified OFF cells utilized hyperpolarizing signals from red, red and green, or red and blue cones at ON, but only depolarizing red cone signals at OFF. ON and OFF depolarizing transients from red cones appear widely distributed within IPL strata. "C-type" physiologies, depolarized by some wavelengths, hyperpolarized by others, in biphasic or triphasic spectral patterns, originated with amacrine cells monostratified in s5. Collectively, cells in this stratum processed signals from all cone types. J. Comp. Neurol. 525:1532-1557, 2017. © 2016 Wiley Periodicals, Inc.

Keywords: 3D-reconstruction; GE4a transgenic; OFF response; ON response; ON-OFF response; RRID: SCR_001775; RRID: SCR_002368; RRID: SCR_002798; RRID: SCR_003070; RRID: SCR_008406; RRID: SCR_008593; RRID: SCR_008597; RRID: SCR_008960; RRID: SCR_011323; RRID: SCR_013318; RRID: SCR_013672; enhancer trap; inner plexiform layer; spectral model; wavelength.


Conflict of interest statement

CONFLICT OF INTEREST STATEMENT

None of the authors has any conflict of interest.

Figures

Figure 1
Figure 1
Response amplitude and cone signal measurement. A: Intensity series for ON–OFF amacrine. The root-mean-square (RMS) segments (hatched) show the intervals over which the scaled RMS amplitudes are calculated. The wavelength is 570 nm, the light step is 600 msec, and the stimulus irradiance varies from 2.0 to 5.0 log(·μm−2·s−1), 6.0 to 3.0 log units of neutral density. 22Oct2007 Cell #1 WT. B: The scaled RMS amplitude, calculated in the 300-msec segment after stimulus onset, is plotted against the trough-to-peak amplitude in the same interval for 51 stimuli applied to the cell in A. The comparison line is slope 1. To calculate RMS amplitude, the potential at each time point in the RMS interval is subtracted from baseline, squared, summed, divided by the number of points, and the square root taken. A single scale factor is applied to the raw RMS amplitude to best approximate trough-to-peak amplitude. The response sign is taken from the mean in the interval with respect to baseline. C: Opsin absorbances for red, green, blue, and UV cones. These are the A(λ) functions (Ar570, Ag480, Ab415, Au362) used in Equation 1 to determine the spectral component signals contributing to amacrine responses. The curves are derived from the nomogram of Hughes et al. (1998) for red, green, and blue opsins, and from Palacios et al. (1996) for the UV opsin. [Color figure can be viewed at wileyonlinelibrary.com]
Figure 2
Figure 2
GFP expression pattern in the GE4a retina. A: GE4a larva at 4 days post fertilization. GFP-stained retinal neurons are seen through the pupil (p). Hindbrain structures (hb) label with GFP, as does heart (h). The yolk (y) is autofluorescent. B: Adult GE4a live retinal slice. Select populations of a horizontal cell (hc), amacrine cell (Aoff, Aon), and ganglion cell (Gon) are labeled. The IPL is subdivided into strata s1–s6 (left). The OFF layer of the IPL (sublamina a) is composed of strata s1–s3. The ON layer (sublamina b) is composed of strata s4–s6 (Connaughton et al., 2004). C: Adult GE4a live retinal eyecup, viewed en face. GFP labels a ganglion cell population, together with axons in the optic fiber layer. D: Microelectrode-injected Alexa 594 hydrazide (magenta) stains an OFF-type amacrine cell in an adult, live, flattened GE4a eyecup. Alexa 594-stained dendrites (reconstructed in Fig. 7) course close to GFP-stained amacrine cell bodies. Image A, fluorescence binocular scope; B and D, confocal; D, widefield microscopy. Images B and C are z-axis projections of two to four planes. Image D is a z-axis projection of ~100 planes. Scale bar = 1mm in A; 20μm in B–D. [Color figure can be viewed at wileyonlinelibrary.com]
Figure 3
Figure 3
ON–OFF amacrine, a/b bistratified type. A: Transient depolarizations (dep) following stimulus onset and offset are evoked by wavelengths from 330 to 650 nm. Numbers above each trace are the stimulus irradiances in log(·μm−2·s−1). Waveforms are filtered by a 33-point (16.5-msec) running average. Penetration potential, −33 mV. B: The spectral model (Eq. 1, 27 stimuli) is fit both at ON (ON dep, open circles) and at OFF (OFF dep, filled triangles) to the RMS amplitudes during the 300 msec after stimulus onset, or the 300 msec after stimulus offset. Spectral amplitudes are interpolated (Eq. 1) for constant quanta stimuli of 2.5 log(·μm−2·s−1) at all wavelengths. Fit parameters (± SE) indicate that only red cone signals are significant for ON and OFF depolarizations (Vr570 ≠ 0). C: Neurolucida reconstruction of the microelectrode injected cell whose responses appear in A. D: Rotation of the 3D reconstruction reveals two planes of dendritic branching in IPL s2 and s5. 16Sept2009 Cell#1, adult GE4a. Scale bar = 10 μm in C and D. [Color figure can be viewed at wileyonlinelibrary.com]
Figure 4
Figure 4
Axon-bearing ON–OFF amacrine, a/b bistratified type. A: Transient depolarizing (dep) voltage changes following stimulus onset or offset are seen for all wavelengths from 330 to 650 nm. Numbers above each trace are the stimulus irradiances in log(·μm−2·s−1). Waveforms are filtered by a 33-point (16.5-msec) running average. Penetration potential, −30 mV. B: The spectral model (Eq. 1, 38 stimuli) is fit both at ON (ON dep, open circles) and at OFF (OFF dep, filled triangles) to the RMS amplitudes during the 300 msec following onset or offset of the stimuli. The spectral curves are interpolations (Eq. 1) of response amplitudes for constant quantal stimuli at 2.5 log(·μm−2·s−1). Fit parameters (± SE) indicate that only signals from red cones are significant for ON or OFF depolarizations (Vr570 ≠ 0). C: Neurolucida reconstruction of the cell whose responses appear in A. D: Rotation of the 3D reconstruction reveals two planes of dendritic branching in IPL s2 and s4. An axon-like process projects from the s2 arbor, and remains in s2. 13May2010 Cell#1, adult WT. Scale bar = 10 μm in C and D. [Color figure can be viewed at wileyonlinelibrary.com]
Figure 5
Figure 5
ON–OFF-Sustained amacrine, bistratified in sublamina a. A. Wavelengths from 370 to 650 nm all evoke transient, depolarizing (dep) voltage changes following stimulus onset and offset. There is, in addition, a sustained depolarization during the stimulus. Numbers above each trace are the stimulus irradiances in log(·μm−2·s−1). Waveforms are filtered by a 33-point (16.5-msec) running average. Penetration potential, −37 mV. B: The spectral model (Eq. 1, 48 stimuli) is fit both at ON (ON dep, open circles) and at OFF (OFF dep, filled triangles) to the RMS amplitudes during the 300 msec following onset or offset of the stimuli. The spectral curves are interpolations (Eq. 1) of response amplitudes for a constant quantal stimulus of 2.5 log(·μm−2·s−1) at all wavelengths. Fit parameters (± SE) indicate that both red and blue cones make significant contributions to the ON transient (ON dep, Vr570 ≠ 0, Vb415 ≠ 0), but that only red signals appear in the OFF transient (OFF dep, Vr570 ≠ 0). C: Neurolucida reconstruction of the microelectrode stained cell whose responses appear in A reveals an elongated dendritic field. D: Rotation of the 3D reconstruction reveals planes of dendritic branching in both IPL s1 and s3, both within sublamina a (a & a bistratification). 4March2010 Cell #4, adult WT. Scale bar = 20 μm in C and D. [Color figure can be viewed at wileyonlinelibrary.com]
Figure 6
Figure 6
ON–OFF amacrine, monostratified in s3 of sublamina a. A: Wavelengths from 330 nm to 650 nm transiently depolarize (dep) this neuron following both stimulus onset and offset. Numbers above each trace are the stimulus irradiances in log(·μm−2·s−1). Waveforms are filtered by a 33-point (16.5-msec) running average. Penetration potential, −17 mV. B: The spectral model (Eq. 1, 60 stimuli) is fit both to onset (ON dep, open circles) and to offset (OFF dep, filled triangles) transients using RMS amplitudes during the 300-msec time segments after stimulus onset, and after the end of each stimulus. The spectral curves are interpolations (Eq. 1) of amplitudes for constant quantal stimuli at 2.5 log(·μm−2·s−1). Fit parameters (± SE) indicate that depolarization from red cones is significant both at ON and at OFF (Vr570 ≠ 0), and that small hyperpolarizing influences of both green and UV cones are also significant in the ON transient (ON dep, Vg480 ≠ 0, Vu362 ≠ 0). C: Neurolucida reconstruction of the dendritic field. D: Rotation of the 3D reconstruction reveals a single plane of dendritic branching in IPL s3, next to the sublamina a/b border. 6Oct2009 Cell#3, adult GE4a. Scale bar = 10 μm in C and D. [Color figure can be viewed at wileyonlinelibrary.com]
Figure 7
Figure 7
Sustained OFF amacrine cell, monostratified in s2 of IPL sublamina a. A: Sustained hyperpolarization (hyp) during stimulation and transient depolarization (dep) at stimulus OFF are evoked by wavelengths from 330 to 650 nm. This cell spontaneously fires action potentials whose frequency is modulated by light. The traces are unfiltered (0.5 msec sampling). Numbers below each trace are the stimulus irradiances in log(·μm−2·s−1). Penetration potential, −30 mV. B: After filtering out impulse activity (101-point, 50.5-msec running average, not shown), spectral sensitivities were interpolated (Eq. 1, 2.5 log(·μm−2·s−1), 51 stimuli) for the RMS hyperpolarizations during the 300-msec segment following stimulus onset (ON hyp, open circles) and for the RMS depolarizations during the 300 msec following stimulus offset (OFF dep, filled triangles). Fit parameters (± SE) indicate that red cone signals (Vr570 ≠ 0) significantly hyperpolarize the cell at onset, and depolarize the cell at offset. Signals from other cones were not significant. Both hyperpolarization and depolarization are plotted as positive amplitudes. C: Neurolucida reconstruction of the cell’s dendritic field. D: Rotation of the 3D reconstruction reveals a single plane of dendritic branching in IPL s2 (sublamina a). 8Jul2009 Cell #1, adult GE4a. Scale bar = 20 μm in C and D. [Color figure can be viewed at wileyonlinelibrary.com]
Figure 8
Figure 8
Transient OFF amacrine cell, monostratified in s1 of IPL sublamina a. A: Light response waveforms consist of transient hyperpolarization (hyp) at stimulus onset followed by delayed depolarization during the stimulus, and finally, transient depolarization (dep) at stimulus offset. These three components are evoked by all wavelengths (330–650 nm). Numbers adjacent to the photocell offset are the stimulus irradiances in log(·μm−2·s−1). Waveforms are filtered by a 33-point (16.5-msec) running average. Penetration potential, −4 mV. B: Spectral sensitivities for RMS amplitudes of the ON hyperpolarization (ON hyp, 0–100 msec, open circles), and OFF depolarizing transient (OFF dep, 600–900 msec, filled triangles) are interpolated (Eq. 1) for constant quantal stimuli of 2.5 log(·μm−2·s−1). Onset and offset components are spectrally distinct. The fit parameters (± SE) indicate that significant red (Vr570 ≠ 0) and blue (Vb415 ≠ 0) signals contribute to the ON hyperpolarizing transient, but only red (Vr570 ≠ 0) signals contribute to the transient OFF depolarization. C: Neurolucida reconstruction of the dendritic field. D: Rotation of the 3D reconstruction reveals a single plane of dendritic branching in IPL s1, at the amacrine border of sublamina a. 9Dec2009 Cell#8, adult GE4a. Scale bar = 10 μm in C and D. [Color figure can be viewed at wileyonlinelibrary.com]
Figure 9
Figure 9
Properties of transient depolarizations in ON–OFF and OFF amacrine cells. A: Normalized spectra at ON and at OFF for 20 ON–OFF and ON–OFF-Sustained amacrine cells. Physiologies from three stratification patterns are averaged together. Stimulus onset spectrum (open circles); stimulus offset spectrum (filled circles). Both ON and OFF components are dominated by signals from red opsin absorbance (dotted line, the Ar570 template; Hughes et al., 1998). B: Normalized spectra for offset depolarizations (filled circles) from four s1 or s2, OFF sustained and OFF transient amacrine cells. The mean spectrum for OFF-depolarization closely matches the red cone template absorbance (dotted line). In A and B, spectra are means and SEs of normalized spectral fits (Eq. 1), to RMS onset or offset amplitudes for individual-cell stimulus–response datasets. The time segments for RMS amplitude calculation are the first 300 msec of stimulation for ON responses, and the 300 msec following stimulation for OFF responses. The fixed-irradiance for these spectra is 1.9 log(hν·μm−2·s−1). C: Slit-mapped receptive field of ON–OFF amacrine cell. ON–OFF responses occur at all slit positions. Slit width, 85 μm, 610 nm, 4.8 log(hν·μm−2·s−1). Same cell as in Figure 5.
Figure 10
Figure 10
Sustained ON amacrine cell, monostratified in s4 of IPL sublamina b. A: Light stimulation evokes sustained depolarization (dep), without transient depolarization at offset, for all wavelengths (330–650 nm). Numbers above each trace are the stimulus irradiances in log(·μm−2·s−1). Waveforms are filtered by a 33-point (16.5-msec) running average. Penetration potential, −15 mV. B: Spectral sensitivities are fit (Eq. 1) to the RMS amplitudes during the initial 300 msec in each of the 18 stimuli. The spectral curve (ON dep, open circles) is an interpolation (Eq. 1) of the response amplitudes for constant quantal stimuli at 1.9 log(·μm−2·s−1). The fit parameters (± SE) indicate that both red and green cones significantly depolarize the cell (Vr570 ≠ 0, Vg480 ≠ 0). C: Neurolucida reconstruction of the flat-mount dendritic spread for this cell. D: Rotation of this 3D reconstruction reveals a single plane of dendritic branching in IPL s4, in distal sublamina b. The curvature of the dendritic plane results from a retina fold. 04Sept2009 #10, adult GE4a. Scale bar = 10 μm in C and D. [Color figure can be viewed at wileyonlinelibrary.com]
Figure 11
Figure 11
UV depolarized, spectrally biphasic amacrine cell, monostratified in s5 of IPL sublamina b. A: Sustained depolarization occurs with short and UV wavelengths (330–410 nm). Midspectral stimuli evoke transient depolarization followed by sustained hyperpolarization (490 nm). Numbers above each trace are the stimulus irradiances in log(·μm−2·s−1). Waveforms are filtered by a 33-point (16.5-msec) running average. Penetration potential, −8 mV. B: Spectral sensitivities are fit (Eq. 1, 71 stimuli) to the RMS amplitudes of the onset transients (0–100 msec, open triangle) or the sustained response (100–600 msec, open circle). In the transient, UV and blue cone signals are depolarizing (Vu362 ≠ 0, Vb415 ≠ 0), while red cone signals are hyperpolarizing (Vr570 ≠ 0). The sustained phase is similar, except that green cone hyperpolarization (Vg480 ≠ 0) is evident, shifting the peak hyperpolarization from 562 to 506 nm. The green cone hyperpolarizing signal appears delayed. C: Neurolucida reconstruction of this cell. D: Rotation of the 3D reconstruction reveals a single plane of dendritic branching in IPL s5, in the middle of sublamina b. 10Nov2009 Cell#1, adult WT. Scale bar = 10 μm in C and D. [Color figure can be viewed at wileyonlinelibrary.com]
Figure 12
Figure 12
UV depolarized, spectrally triphasic amacrine cell, monostratified in s5 of IPL sublamina b. A: Sustained depolarization occurs with UV (370 nm) and mid spectral (490 nm) stimuli. Depolarization is weak at other wavelengths. Numbers above each trace are the stimulus irradiances in log(·μm−2·s−1). Waveforms are filtered by a 33-point (16.5-msec) running average. Penetration potential, −9 mV. B: Spectral sensitivities are fit (Eq. 1, 33 stimuli) to either the onset transient (0–100 msec, open triangles) or to the sustained response (100–600 msec, open circles). In the analysis, onset transients consist of depolarizing signals arising from UV cones (Vu362 ≠ 0). In the sustained component, signals arising from both UV and green cones depolarize the cell (Vu362 ≠ 0, Vg480 ≠ 0), while blue cone signals are hyperpolarizing (Vb415 ≠ 0). C: Neurolucida projection of the reconstructed cell. Examination of the image stack reveals a single plane of dendritic branching in IPL s5, in the middle of sublamina b. 14Nov2007 Cell#3, adult WT. Scale bar = 10 μm in C. [Color figure can be viewed at wileyonlinelibrary.com]
Figure 13
Figure 13
Long wavelength depolarized, spectrally biphasic amacrine cell, monostratified in s5 of IPL sublamina b. A: Transient depolarization is seen with red (650 nm) or yellow (570 nm) stimuli, but hyperpolarization is evoked for mid and short wavelength stimuli (490 and 410 nm, respectively). Numbers below each trace are the stimulus irradiances in log(·μm−2·s−1). Waveforms are filtered by a 33-point (16.5-msec) running average. Penetration potential, −12 mV. B: Spectral sensitivities are fit (Eq. 1) to the RMS amplitudes during the initial 300 msec in each of the 39 stimuli. The three spectral curves of increasing amplitude are Equation 1 interpolations of the response amplitudes for constant quantal stimuli at 1.9, 2.5, or 3.1 log(·μm−2·s−1). The fit parameters (± SE) suggest that depolarization from red cones is significant (Vr570 ≠ 0), while hyperpolarization is driven by both green and blue cones (Vg480 ≠ 0, Vb415 ≠ 0). C: An elongate dendritic field is seen in Neurolucida reconstruction of this cell. D: Rotation of the 3D reconstruction reveals a single dendritic branching plane in IPL s5 (sublamina b). 20May2010 Cell#6, adult GE4a. Scale bar = 20 μm in C and D. [Color figure can be viewed at wileyonlinelibrary.com]
Figure 14
Figure 14
IPL branching patterns of electrophysiologically grouped zebrafish amacrine cells. A,B: ON physiologies are recorded from monostratified cells arborizing mainly in s4, but occasionally in s3. C,D: ON–OFF and ON–OFF-Sustained physiologies almost always arise from bistratified dendritic patterns. Most (D) branch in both sublamina a (s1 or s2) and sublamina b (s4 or s5). Others (C) are bistratified within sublamina a, occupying s1, and either s2 or s3. E: Rarely, an ON–OFF type is monostratified in s2 or s3, sublamina a. F,G: OFF physiologies come from cells monostratified in either s1 or s2. H: C-type physiologies are depolarized by some wavelengths and hyperpolarized by others, with a variety of spectral patterns. C-type physiology occurs mainly in s5-monostratified amacrines of sublamina b. Ganglion cell (GC) bodies occupy the s6 border of the IPL. The breadth of amacrine stratification bands represent the depth range within the IPL occupied by the dendrites of the physiological groups. The “cone signals” legend (above) gives the polarities and types of cone inputs (r, g, b, u) in each waveform/stratification group. D and H stand for depolarizing or hyperpolarizing signals at onset (ON) or offset (OFF). [Color figure can be viewed at wileyonlinelibrary.com]

Similar articles

Cited by

References

    1. Ammermüller J, Muller JF, Kolb H. The organization of the turtle inner retina. II. Analysis of color-coded and directionally selective cells. J Comp Neurol. 1995;358:35–62. - PubMed
    1. Arenzana FJ, Clemente D, Sánchez-González R, Porteros Á, Aijón J, Arévalo R. Development of the cholinergic system in the brain and retina of the zebrafish. Brain Res Bull. 2005;66:421–425. - PubMed
    1. Avdesh A, Martin-Iverson MT, Mondal A, Chen M, Askraba S, Morgan N, Lardelli M, Groth DM, Verdile G, Martins RN. Evaluation of color preference in zebrafish for learning and memory. J Alzheim Dis. 2012;28:459–469. - PubMed
    1. Baden T, Esposti F, Nikolaev A, Lagnado L. Spikes in retinal bipolar cells phase-lock to visual stimuli with millisecond precision. Curr Biol. 2011;2:1859–1869. - PMC - PubMed
    1. Barlow HB, Levick WR. The mechanism of directionally selective units in rabbit’s retina. J Physiol. 1965;178:477–504. - PMC - PubMed

MeSH terms

LinkOut - more resources