. 2016 Nov;19(11):1463-1476.
doi: 10.1038/nn.4373. Epub 2016 Aug 29.

Genome-wide, integrative analysis implicates microRNA dysregulation in autism spectrum disorder

Affiliations

Genome-wide, integrative analysis implicates microRNA dysregulation in autism spectrum disorder

Ye E Wu et al. Nat Neurosci. 2016 Nov.

Abstract

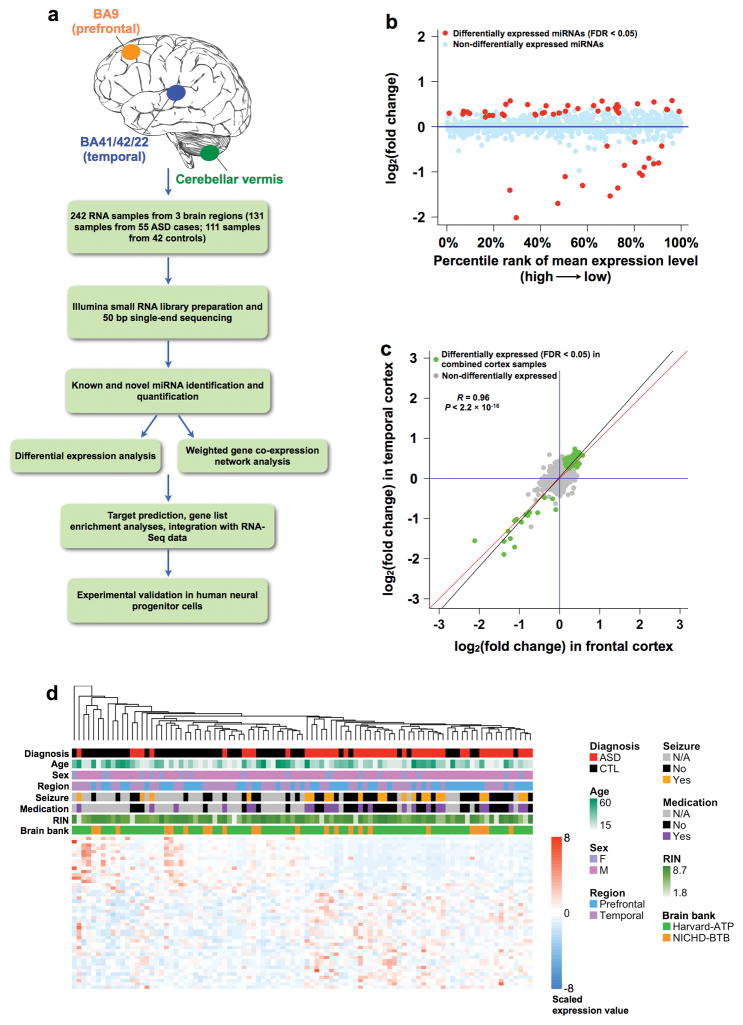
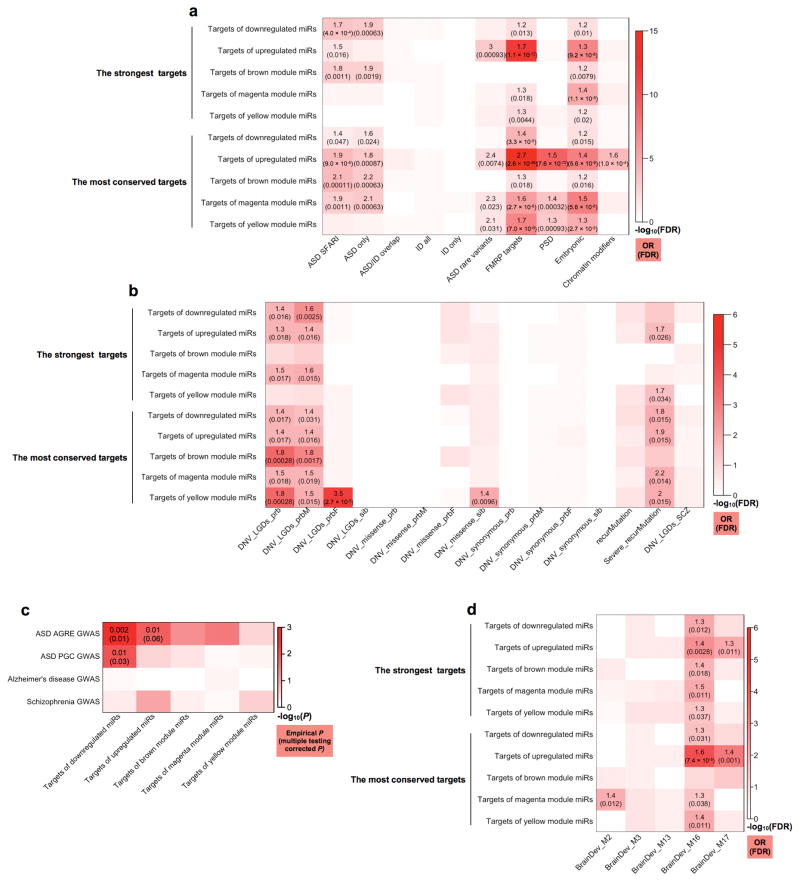
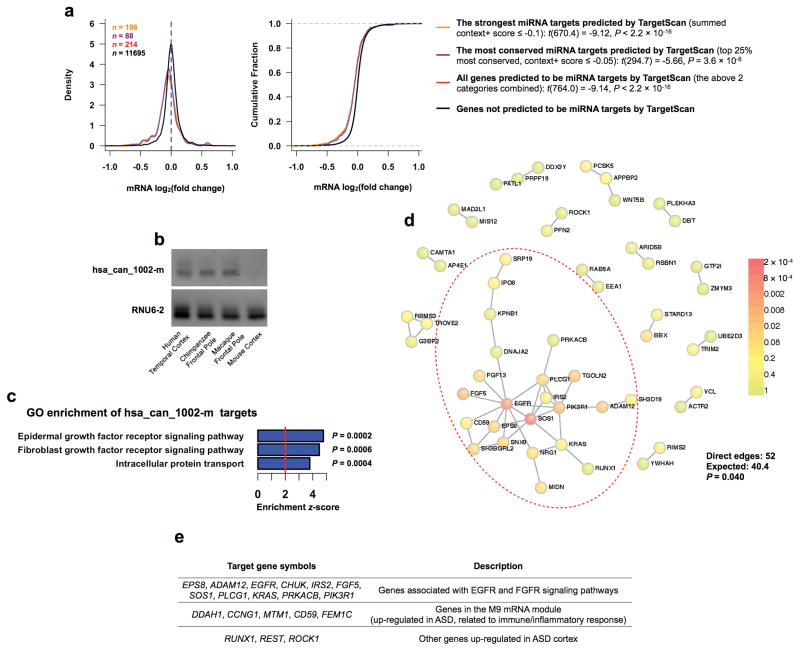
Genetic variants conferring risk for autism spectrum disorder (ASD) have been identified, but the role of post-transcriptional mechanisms in ASD is not well understood. We performed genome-wide microRNA (miRNA) expression profiling in post-mortem brains from individuals with ASD and controls and identified miRNAs and co-regulated modules that were perturbed in ASD. Putative targets of these ASD-affected miRNAs were enriched for genes that have been implicated in ASD risk. We confirmed regulatory relationships between several miRNAs and their putative target mRNAs in primary human neural progenitors. These include hsa-miR-21-3p, a miRNA of unknown CNS function that is upregulated in ASD and that targets neuronal genes downregulated in ASD, and hsa_can_1002-m, a previously unknown, primate-specific miRNA that is downregulated in ASD and that regulates the epidermal growth factor receptor and fibroblast growth factor receptor signaling pathways involved in neural development and immune function. Our findings support a role for miRNA dysregulation in ASD pathophysiology and provide a rich data set and framework for future analyses of miRNAs in neuropsychiatric diseases.


Conflict of interest statement

COMPETING FINANCIAL INTERESTS

The authors declare no competing financial interests.

Figures

Figure 1
Figure 1. miRNA expression changes in post-mortem ASD cortex
(a) Flow chart of the overall approach. (b) miRNA expression fold changes (> 0 if higher in ASD, < 0 if lower in ASD) between ASD and control cerebral cortex, plotted against the percentile rank of mean expression levels across 95 cortex samples (47 samples from 28 ASD cases and 48 samples from 28 controls) used for DGE analysis. Differentially expressed (linear mixed-effects model, FDR < 0.05) miRNAs are highlighted in red. (c) Comparison of miRNA expression fold changes in the temporal and the frontal cortex. Green dots, 58 miRNAs differentially expressed (FDR < 0.05) in 95 combined cortex samples; grey dots, non-differentially expressed miRNAs; black line, regression line between fold changes in the temporal and the frontal cortex for the differentially expressed miRNAs; red line, y=x. The Pearson correlation coefficient (R) and P value are also shown. (d) Dendrogram showing hierarchical clustering of 95 cortex samples based on top differentially expressed (FDR < 0.05, |log2(fold change)| ≥ 0.3) miRNAs. Information on diagnosis, age, sex, brain region, co-morbidity of seizures, psychiatric medication, RIN, and brain bank is indicated with color bars below the dendrogram according to the legend on the right. Heatmap on the bottom shows scaled (mean extracted and divided by standard deviation) expression values (color-coded according to the legend on the right) for miRNAs used for clustering.
Figure 2
Figure 2. miRNA co-expression modules dysregulated in post-mortem ASD cortex
(a) Dendrogram showing miRNA co-expression modules defined in 109 cortex samples. Color bars below indicate original module assignment, consensus module assignment based on 200 rounds of bootstrapping, Pearson correlation coefficients with diagnosis and other potential confounders or covariates (all treated as numeric variables), and expression level for each miRNA. Arrows indicate three modules (brown, magenta, and yellow) significantly correlated with diagnosis. (bd) Pearson correlation between module eigengenes and different covariates in 109 cortex samples (b), 47 cortex samples from patients aged 15 to 30 years (c), and 42 cortex samples from patients > 30 years (d). Correlation coefficients (R) and FDRs (Methods) are shown where FDR < 0.05. (ej) Scaled module eigengene values across 109 cortex samples (e, g, i) and network plots (f, h, j) for the brown (e, f), magenta (g, h), and yellow (i, j) modules. In (e, g, i), samples are plotted in groups according to disease status and sex and color-coded as indicated above the graphs, and ordered by age as indicated below the graphs. In (f, h, j), miRNAs with kME (Methods) ≥ 0.5 are plotted according to multidimensional scaling (MDS) of miRNA correlations. Edge thickness is proportional to the positive correlation between the two connected miRNAs and node size is proportional to node connectivity. Enriched transcription factors (TF) and chromatin regulators (CR) (Fisher’s exact test, FDR < 0.05) are listed below the plot. Underlined, TF/CR differentially expressed (P < 0.05) in ASD cortex.
Figure 3
Figure 3. Enrichment of ASD risk genes among the top targets of ASD-affected miRNAs and miRNA modules
(a) Heatmap showing enrichment (Fisher’s exact test) of ASD risk genes from SFARI (ASD SFARI) or implicated by rare variants (ASD rare variants), intellectual disability genes (ID all), genes encoding transcripts bound by FMRP (FMRP targets), genes encoding proteins in the postsynaptic density (PSD), genes expressed preferentially in human embryonic brains (Embryonic), and genes encoding chromatin modifiers. “ASD/ID overlap”, the overlap between the “ASD SFARI” and “ID all” sets. “ASD only” and “ID only”, non-overlapping ASD SFARI and ID genes, respectively. (b) Heatmap showing enrichment (logistic regression) of genes affected by de novo variants (DNVs), including likely gene-disrupting (LGD), missense, synonymous, and recurrent (recurMutation) mutations, in ASD-affected probands (prb, all probands; prbM, male probands; prbF, female probands) and unaffected siblings (sib). “Severe_recurMutation”, genes targeted by protein-disrupting recurrent mutations. “DNV_LGDs_SCZ”, LGD DNVs in individuals with schizophrenia. (c) Enrichment for overlap with linkage disequilibrium-based independent genomic regions associated with ASD (from Autism Genetic Resource Exchange [AGRE] or Psychiatric Genomics Consortium [PGC]), Alzheimer’s disease, or schizophrenia in GWAS among the strongest miRNA targets. The empirical and multiple-testing corrected P values calculated using the INRICH program are shown where the corrected P < 0.10. (d) Heatmap showing enrichment (Fisher’s exact test) for ASD-associated developmental gene co-expression modules in human cortex. In (a, b, d), enrichment odds ratios (OR) and FDR corrected P values (Methods) are shown for enrichments with FDR < 0.05.
Figure 4
Figure 4. Relationship between miRNA and mRNA expression changes in post-mortem ASD cortex
(ac) Correlations between the PC1s of differentially expressed miRNAs (FDR < 0.05, |log2(fold change)| ≥ 0.3) and differentially expressed mRNAs (FDR < 0.05) that are predicted targets (after regressing out disease status) in 101 cortex samples. (a) All differentially expressed miRNAs vs. all differentially expressed mRNAs; (b) up-regulated miRNAs vs. down-regulated mRNAs; (c) down-regulated miRNAs vs. up-regulated mRNAs. Pearson correlation coefficients (R) and P values are shown below the plots. (d) Negative correlations between the PC1s of top miRNAs in the ASD-associated miRNA modules and their predicted targets in the ASD-associated mRNA models. mRNA modules are represented with network plots showing the top 20 most connected module genes. Pearson correlation coefficients (R) and P values are indicated. Correlations for the magenta and yellow miRNA modules were calculated using 45 younger samples (ages between 15 and 30 years), given their stronger disease association at younger ages relative to older ages (> 30 years).
Figure 5
Figure 5. Enrichment for ASD-affected mRNAs and mRNA modules within the top targets of ASD-affected miRNAs
(a) Heatmap showing enrichment (Fisher’s exact test) for ASD-affected mRNAs and mRNA modules within the top targets of ASD-related miRNA modules. P values were FDR corrected across 6 target groups for each mRNA group. Odds ratios and FDRs are shown for enrichments with FDR < 0.05. (b) Model for the role of miRNA dysregulation in ASD molecular pathology. The up-regulated miRNAs and miRNA modules may play a contributory role by repressing ASD risk genes and neuronal/synaptic genes down-regulated in ASD. The down-regulated miRNAs and miRNA module may contribute to the up-regulation of immune/inflammatory genes in ASD, but might also play a compensatory role given the enrichment of their targets for rare protein-disrupting and common genetic variants associated with ASD. (cd) Enrichment (Fisher’s exact test) for ASD-affected mRNAs and mRNA modules within the strongest (c) or the most conserved (d) targets of individual candidate miRNAs.
Figure 6
Figure 6. hsa-miR-21-3p targets neuronal genes down-regulated in ASD
(a) Distributions (left) and cumulative distributions (right) of mRNA log2(fold change) in response to over-expression of hsa-miR-21-3p in hNPCs. Statistical significance between target groups and non-targets was assessed using one-sided t-tests assuming unequal variance. (be) Heatmaps showing enrichment of validated hsa-miR-21-3p targets for ASD-related gene lists (bd) as well as ASD-affected mRNAs and mRNA modules (e). (b) Logistic regression, (ce) Fisher’s exact test. Odds ratios and P values are shown where P < 0.05. (f) A partial list of validated hsa-miR-21-3p target genes associated with ASD.
Figure 7
Figure 7. hsa_can_1002-m is primate-specific and targets genes in the EGFR and the FGFR signaling pathways
(a) Distributions (left) and cumulative distributions (right) of mRNA log2(fold change) in response to over-expression of hsa_can_1002-m in hNPCs. Statistical significance between target groups and non-targets was assessed using ones-sided t-tests assuming unequal variance. (b) RT-PCR in human, chimpanzee, macaque, and mouse cortices using primers designed for human hsa_can_1002-m. RNU6-2 was used as control. The experiment was repeated twice and the result was reproducible. (c) Top GO terms for validated hsa_can_1002-m targets. Uncorrected P values are shown. (d) Direct protein-protein interaction network between validated hsa_can_1002-m targets. Nodes are colored based on the P values of the seed proteins (the probability that by chance the seed protein would be as connected as is observed) according to the legend on the right. (e) A partial list of validated hsa_can_1002-m target genes.
Figure 8
Figure 8. Experimental validation of targets of other candidate miRNAs
(ac) Distributions (left) and cumulative distributions (right) of mRNA log2(fold change) in response to over-expression of hsa-miR-103a-3p (a), hsa-miR-143-3p (b), and hsa-miR-23a-3p (c) in hNPCs. Statistical significance between target groups and non-targets was assessed using ones-sided t-tests assuming unequal variance. (d) Enrichment (Fisher’s exact test) of validated targets of hsa-miR-103a-3p and hsa-miR-143-3p for down-regulated mRNAs and the down-regulated M16 mRNA module. (e) Enrichment (Fisher’s exact test) of validated targets of hsa-miR-23a-3p for ASD SFARI genes and ASD risk genes implicated by rare variants. (f) A partial list of validated target genes.

References

    1. Bourgeron T. From the genetic architecture to synaptic plasticity in autism spectrum disorder. Nat Rev Neurosci. 2015;16:551–563. - PubMed
    1. Geschwind DH, State MW. Gene hunting in autism spectrum disorder: on the path to precision medicine. Lancet Neurol. 2015;14:1109–1120. - PMC - PubMed
    1. Gaugler T, et al. Most genetic risk for autism resides with common variation. Nat Genet. 2014;46:881–885. - PMC - PubMed
    1. Geschwind DH, Flint J. Genetics and genomics of psychiatric disease. Science. 2015;349:1489–1494. - PMC - PubMed
    1. Ha M, Kim VN. Regulation of microRNA biogenesis. Nat Rev Mol Cell Biol. 2014;15:509–524. - PubMed

Publication types