. 2016 Oct;157(10):3742-3748.
doi: 10.1210/en.2016-1480. Epub 2016 Aug 29.

A Convenient Method for Evaluating Epithelial Cell Proliferation in the Whole Mammary Glands of Female Mice

Affiliations

A Convenient Method for Evaluating Epithelial Cell Proliferation in the Whole Mammary Glands of Female Mice

Grace E Berryhill et al. Endocrinology. 2016 Oct.

Abstract

The mammary glands (MG) undergo rapid expansion of the ductal network during puberty in response to endocrine cues including the potent mitogenic effects of estrogen. The proliferation of mammary epithelial cells occurs in a spatially distinctive manner, where terminal end buds located at the ductal termini are the primary site of cell division. Here, we present a relatively high throughput approach to spatially assess epithelial cell proliferation in whole mouse MG using histochemical detection of 5-ethynyl-2'-deoxyuridine in conjunction with a standard curve-based data deconvolution technique to semiquantitatively measure proliferation via wide-field epifluorescent microscopy. This approach was validated against the "gold standard" of counting labeled nuclei from confocal images utilizing computer-assisted image analysis. Our method proved sensitive enough to describe the significant and spatially variable proliferative response to low-dose estrogen after 108 hours. This flexible method presents a timely and economical approach to obtaining spatial information regarding epithelial cell proliferation in the mouse MG.


Figures

Figure 1.
Figure 1.
Image acquisition and analysis procedures for semiquantitative determination of epithelial cell proliferation in whole mouse MG. Representative images of whole mouse MG from mice OVX at 21 days of age and treated with either vehicle (A and B and E and F) or 17β-estradiol (200nM in drinking water) (C and D and G and H) for 156 hours. Low-magnification images of whole DAPI-stained MG were captured (A and C), and ductal termini at the leading edge of the ductal network were tagged (B and D) for imaging at higher magnification. Scale bar, 1 mm. Proliferating epithelial cells were detected using Alexa Fluor 488 Click-iT histochemistry for EdU (F and H) against a DAPI counterstain (E and G). Exposure time was recorded for each image acquired. Mean grayscale values (AUs) were measured from a user-defined ROI (red asterisk) for both Alexa Fluor 488 and DAPI images using FIJI. Background mean grayscale values were also recorded (open circle). Scale bar, 100 μm.
Figure 2.
Figure 2.
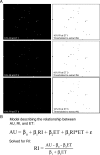
Quantification of RI using a standard curve derived from InSpeck fluorescent beads. A, Representative images of InSpeck fluorescent beads (green) having 10% RI. Images were captured at 5–6 different ETs ranging from near-saturated to near-absent signal. Representative images depicting high (ET1), intermediate (ET3), and low (ET5) signal are shown in A. Thresholding was applied to these images, and mean grayscale values (AUs) were measured using FIJI. B, Regression model describing the relationship between AU, ET, and RI, including random error (ϵ). Known RI and ET, along with measured AU from the InSpeck fluorescent bead standards, allows for extraction of regression coefficients (β). The model can then be algebraically solved for RI, enabling the calculation of RI for any image where ET and AU are known.
Figure 3.
Figure 3.
Semiquantitative analysis of epithelial cell proliferation using wide-field stereomicroscopy and standard curve-based data deconvolution validates against count-based data collected using confocal microscopy. Representative images of a TEB from a whole thoracic MG from a mouse OVX at 21 days of age then treated with 17β-estradiol (200nM in drinking water) for 156 hours. Images were captured using wide-field epifluorescent stereomicroscopy (A) or confocal microscopy (B). Proliferating epithelial cells labeled with EdU (green) were detected using Alexa Fluor 488 Click-iT histochemistry against a DAPI counterstain (blue). Scale bar, 50 μm. C, Confocal images were analyzed using Imaris image analysis software, enabling the automated quantification of green and blue nuclei. D, Plot of mean green to blue nuclear counts from confocal images (primary y-axis) and mean green to blue RI from wide-field images (secondary y-axis) for mice administered 17β-estradiol (200nM in drinking water) for either 12, 84, or 156 hours; n = 4 biological replicates with 3 subsamples per group. E, Log[green to blue (RI), y-axis] representing data that was deconvoluted from InSpeck fluorescent bead standard curves was regressed against Log[green to blue (count), x-axis] quantified using Imaris. Each data point is an average of 3 subsamples for a single animal (n = 12). Linear regression was significant (P < .05).
Figure 4.
Figure 4.
Estrogen stimulates epithelial cell proliferation in the ductal termini of whole mouse MG. A, Representative image a whole MG from a mouse OVX at 21 days of age then administered 17β-estradiol in the drinking water (200nM) for 156 hours. Proliferating epithelial cells were detected by EdU histochemistry (green), with DAPI overlay (blue). Arrows indicate proliferative TEBs. Asterisks indicate termini with a low level of proliferation. B, Relative fluorescence intensity was quantified using FIJI, and data were deconvoluted using a standard curve-based approach and expressed as the ratio of green to blue fluorescence. Data are mean green to blue ratio ± SEM; n = 4–9/time points per group; *, P < .05 vs control within a time point. C, Frequency histograms for RI of individual termini, with overlaid density plots, at various time points following treatment with vehicle or 17β-estradiol (n = 27–56 termini/group per time point).

References

    1. Hovey RC, Trott JF, Vonderhaar BK. Establishing a framework for the functional mammary gland: from endocrinology to morphology. J Mammary Gland Biol Neoplasia. 2002;7:17–38. - PubMed
    1. Daniel CW, Silberstein GB, Strickland P. Direct action of 17 β-estradiol on mouse mammary ducts analyzed by sustained release implants and steroid autoradiography. Cancer Res. 1987;47:6052–6057. - PubMed
    1. Hinck L, Silberstein GB. Key stages in mammary gland development: the mammary end bud as a motile organ. Breast Cancer Res. 2005;7:245–251. - PMC - PubMed
    1. Russo J, Russo IH. Biological and molecular bases of mammary carcinogenesis. Lab Invest. 1987;57:112–137. - PubMed
    1. Osborne G, Rudel R, Schwarzman M. Evaluating chemical effects on mammary gland development: a critical need in disease prevention. Reprod Toxicol. 2015;54:148–155. - PubMed

Publication types