

Review
doi: 10.1038/nn.4365.
Improving data quality in neuronal population recordings
Affiliations
- PMID: 27571195
- PMCID: PMC5244825
- DOI: 10.1038/nn.4365
Item in Clipboard
Review
Improving data quality in neuronal population recordings
Nat Neurosci.
.
Abstract
Understanding how the brain operates requires understanding how large sets of neurons function together. Modern recording technology makes it possible to simultaneously record the activity of hundreds of neurons, and technological developments will soon allow recording of thousands or tens of thousands. As with all experimental techniques, these methods are subject to confounds that complicate the interpretation of such recordings, and could lead to erroneous scientific conclusions. Here we discuss methods for assessing and improving the quality of data from these techniques and outline likely future directions in this field.
Figures
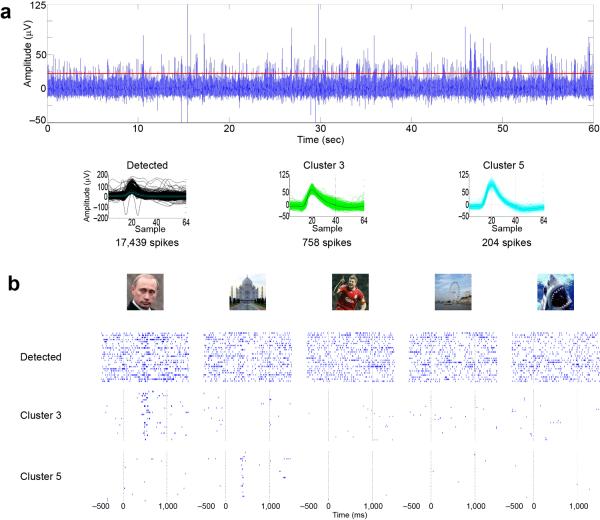
Spike sorting is required to draw valid conclusions in extracellular electrophysiology. (a) Top, extracellular recording from a single microwire electrode in the hippocampus of a patient implanted with intracranial electrodes for clinical reasons. Bottom plots show overlapped all detected spikes (left), and the sorted spikes corresponding to 2 single units (clusters 3 and 5). (b) Responses to 5 pictures presented in an experimental session. Considering all the detected spikes together, no response can be observed in the raster plots. However, a clear response to Vladimir Putin appears when considering only the spikes corresponding to cluster 3, and a response to the Taj Majal appears when considering the spikes corresponding to cluster 5. Time zero corresponds to stimulus onset. For space reasons, only 2 of the 8 identified clusters and only 5 of the 14 presented pictures are shown, but there were no responses for these other clusters and pictures. Adapted from Ref.9.
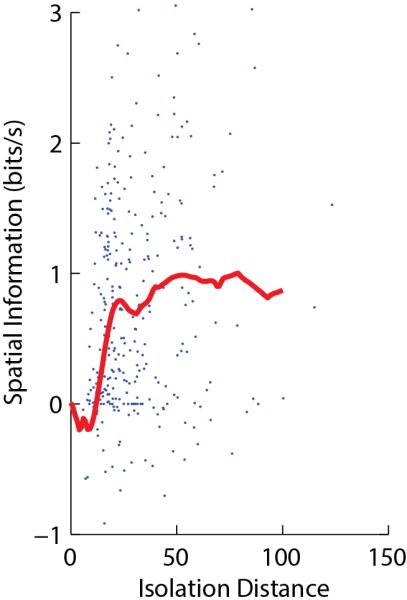
Quantitative measures of unit isolation in extracellular electrophysiology. Each point represents a single neuron recorded in CA1 of a rat exploring an environment, showing isolation distance (a measure of unit isolation quality) vs. estimated spatial information content (which can be negative as it is computed by cross-validation). The red curve represents a running median. The curve reaches an asymptote of ~1 bit/s for values of isolation distance greater than ~20, indicating that this is the true average for well-isolated cells. Data reanalyzed from Ref.142, with some points above the top y-axis value truncated for visualization purposes.
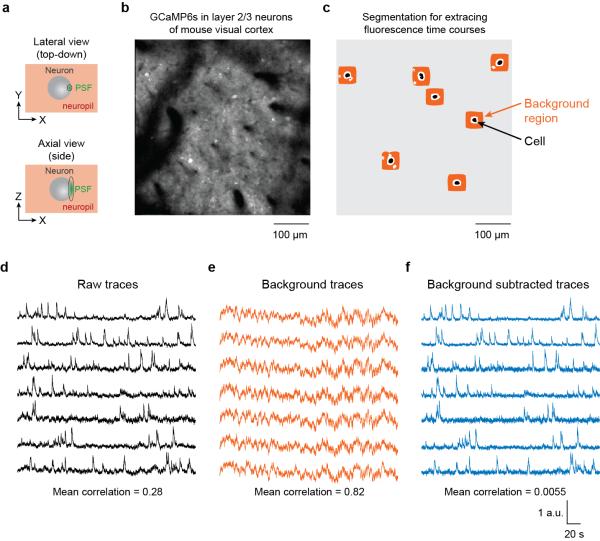
Subtracting neuropil contamination from raw fluorescence time courses. (a) In two-photon imaging, the point spread function (PSF) is elongated in the axial dimension even in high numerical aperture systems. Pixels within the borders of cell bodies still contain signals from the surrounding neuropil. (b) The GECI GCaMP6s was expressed in mouse visual cortex neurons, resulting in brightly labeled cell bodies and neuropil. (c) Binary masks for cell body ROIs (black) were identified semi-automatically and neuropil regions were algorithmically constructed (avoiding pixels belonging to other potential cell bodies or black regions). (d) Raw traces for the fluorescence time courses of the selected cells. (e) Fluorescence time courses for the background regions for each selected cell. Note the high temporal correlation. (f) Fluorescence time courses after background subtraction. Note the reduced mean correlation. All traces have been scaled to the same maximum height to better exhibit details in the time courses. Figure credit: J. N. Stirman, Y. Yu, S. L. Smith
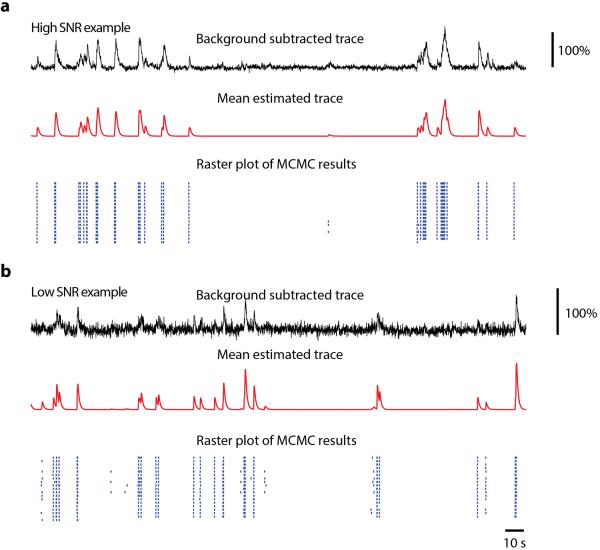
Probabilistic estimation of spike times from calcium signals. A model of calcium signal generation is inverted to yield a probability distribution of spike trains (blue raster), given a single observed calcium trace (black). (a), high signal-to-noise data leads to a highly certain estimate of spiking. (b), low signal-to-noise leads to an uncertain estimate, illustrated by the raster showing different spike trains that could have generated the calcium signal. Subsequent analysis can be performed using the entire spike train distribution. Figure credit: J. N. Stirman, Y. Yu, S. L. Smith.
References
-
- Buzsaki G. Large-scale recording of neuronal ensembles. Nat Neurosci. 2004;7:446–451. - PubMed
-
- Gold C, Henze DA, Koch C, Buzsaki G. On the origin of the extracellular action potential waveform: A modeling study. J Neurophysiol. 2006;95:3113–3128. - PubMed
-
- Quian Quiroga R. Quick guide: Spike sorting. Current Biology. 2012;22:R45–R46. - PubMed
-
- Lewicki MS. A review of methods for spike sorting: the detection and classification of neural action potentials. Network. 1998;9:R53–R78. - PubMed
Publication types
MeSH terms
Grants and funding
LinkOut - more resources
Full Text Sources
Other Literature Sources
Research Materials
