Review
. 2016 Aug 26;19(9):1175-87.
doi: 10.1038/nn.4361.

The Human Connectome Project's neuroimaging approach

Affiliations
Review

The Human Connectome Project's neuroimaging approach

Matthew F Glasser et al. Nat Neurosci. .

Abstract

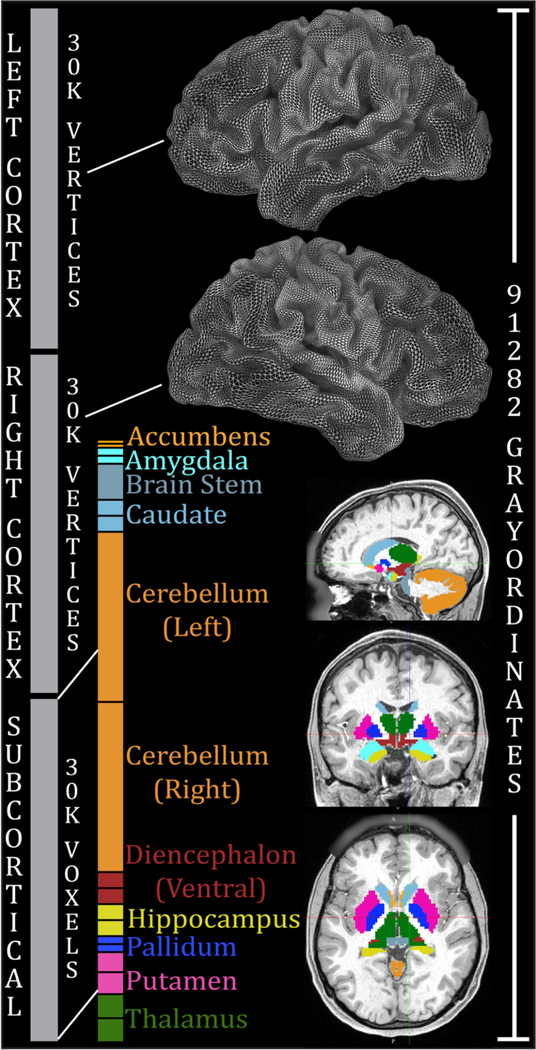
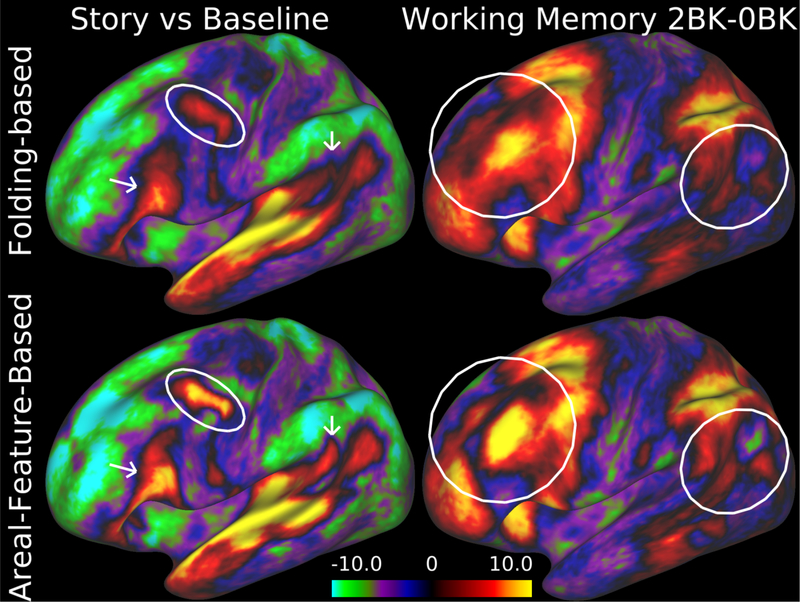
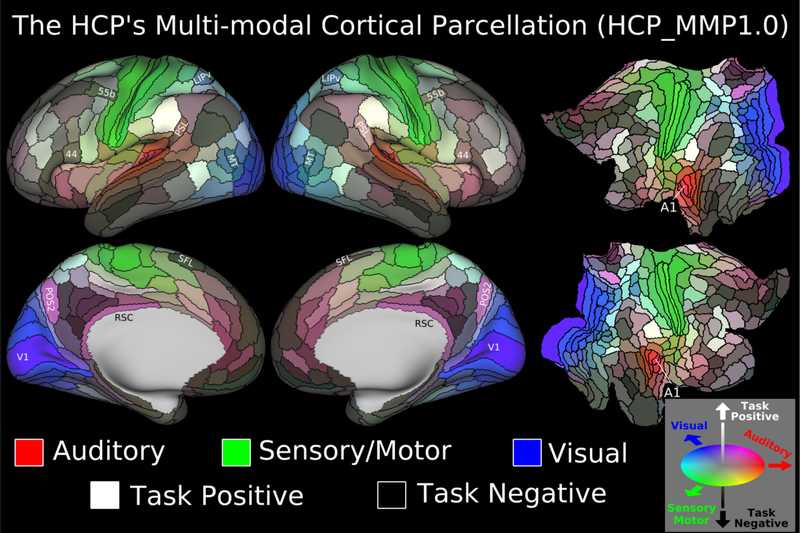
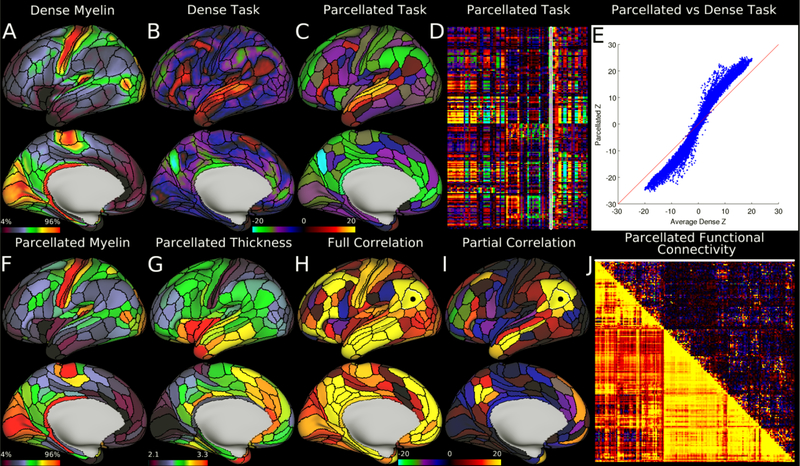
Noninvasive human neuroimaging has yielded many discoveries about the brain. Numerous methodological advances have also occurred, though inertia has slowed their adoption. This paper presents an integrated approach to data acquisition, analysis and sharing that builds upon recent advances, particularly from the Human Connectome Project (HCP). The 'HCP-style' paradigm has seven core tenets: (i) collect multimodal imaging data from many subjects; (ii) acquire data at high spatial and temporal resolution; (iii) preprocess data to minimize distortions, blurring and temporal artifacts; (iv) represent data using the natural geometry of cortical and subcortical structures; (v) accurately align corresponding brain areas across subjects and studies; (vi) analyze data using neurobiologically accurate brain parcellations; and (vii) share published data via user-friendly databases. We illustrate the HCP-style paradigm using existing HCP data sets and provide guidance for future research. Widespread adoption of this paradigm should accelerate progress in understanding the brain in health and disease.


Conflict of interest statement

The authors declare no competing financial interests.

Figures

Figure 1.
Figure 1.
Combined representation of cortical surface vertices and subcortical voxels in the CIFTI grayordinates standard space. Left and right cerebral cortices contribute about 30k surface vertices each (fewer than the 32k vertex standard meshes for each hemisphere, because the non-cortical medial wall is not included). Additionally, 19 subcortical grey matter structures combine to contribute about 30k volume voxels. In total, there are 91,282 grayordinates corresponding to all of the grey matter sampled at a 2 mm average vertex spacing on the surface and as 2 mm voxels subcortically. The HCP’s minimal preprocessing pipelines ensure that each subject has 91,282 aligned grayordinates, thereby facilitating cross-subject comparisons of data within this coordinate system. This entails more than a two-fold reduction in file size relative to the >200,000 voxels needed for an equivalent 2 mm isotropic volume representation. For the 1.6mm 7T HCP data, we have developed a 1.6mm standard grayordinates space with 170,494 grayordinates using “59k” surface meshes. Reproduced with permission from Reference .
Figure 2.
Figure 2.
Improved intersubject registration using information based on areal features in addition to cortical folding. The top row shows group task-fMRI z-stat maps (“Story vs Baseline” contrast from the language task on the left and the two-back vs zero-back contrast in the working memory task on the right) from 120 Q1 and Q2 HCP subjects after intersubject registration using the Multimodal Surface Matching (MSM) method constrained only by folding (FreeSurfer’s ‘sulc’ maps). Bottom row shows sharper group task-fMRI maps and higher z-statistics when using resting-state networks (RSN) along with myelin maps to constrain the registration. For the data in this figure and figure 6, subject recruitment procedures and informed consent forms, including consent to share de-identified data, were approved by the Washington University institutional review board. Data at http://balsa.wustl.edu/97V4.
Figure 3.
Figure 3.
The HCP_MMP1.0 (HCP Multi-Modal Parcellation, v 1.0). Each panel shows 180 cortical areas delineated and identified in the left or right hemisphere, displayed on an inflated or flattened cortical surface. Black outlines indicate areal borders. Colors indicate to what extent the areas are associated in the resting state to auditory (red), somatosensory (green), visual (blue), task positive (towards white), or task negative (towards black) systems. The legend on the bottom right illustrates the 3D color space used in the figure. Reprinted from ref. Data at http://balsa.wustl.edu/WN56.
Figure 4.
Figure 4.
Example parcellated analyses run using HCP data and the HCP_MMP1.0 cortical parcellation. Panels A and F, showing dense and parcellated myelin maps respectively, are very similar despite a dramatic dimensionality reduction. Panel G shows a map of parcellated cortical thickness (in millimeters; corrected for folding by regressing out mean surface curvature). Panels B and C show example dense and parcellated task fMRI analysis (LANGUAGE Story vs Baseline). Panel D shows the entire HCP task fMRI battery’s Z statistics (86 contrasts; 47 distinct and 39 sign-reversed versions) analyzed in parcellated form and displayed as a matrix (rows are parcels, columns are contrasts, white outline indicates the map displayed in Panel C). Panel E demonstrates a major improvement in Z statistics from fitting a task design on parcellated data instead of fitting it on dense data, and then parcellating afterwards. Panels H and I show parcellated functional connectivity maps on the brain (seeded from area PGi, black dot). In both cases, the task negative (default mode) network is apparent. Panel J shows a parcellated connectome matrix view with the full correlation connectome below the diagonal and the partial correlation connectome above the diagonal (white line shows the displayed partial correlation brain map). The figure matches the Connectome Workbench scene available on the BALSA database (http://balsa.wustl.edu/RG0x). Notably, Panel E was generated in matlab and saved as a PNG and then loaded in to Workbench as its own tab. Reprinted from ref.
Figure 5.
Figure 5.
Current and future projects that use HCP-style data acquisition, analysis, and sharing. Projects shown in green will use the Connectome Coordination Facility (CCF, in purple) as their primary mode of data sharing.
Figure 6.
Figure 6.
Fidelity of localizing area MT+ (architectonic area hOc5) when mapped to the cortical surface by different methods. Left: volume-based mapping of probabilistic cytoarchitectonic area hOc5 from 10 postmortem subjects mapped to a cortical atlas surface. Black arrows point to locations where the volumebased mapping spreads across gyral and sulcal folds. Center: Surface-based registration of hOc5 from the same 10 subjects mapped to individual surface reconstructions, then to a surface-based atlas using FreeSurfer’s folding-based surface registration method. White arrows identify ‘outlier’ hOc5 from individual subjects that are not well aligned to the FreeSurfer group average owing to imperfect correspondence between areal boundaries and sulcal folds. Left and center panels adapted from ref. . The white oval is in the same location across all panels showing how the volume-based alignment drifts away from the surfacebased alignments, in addition to having substantially lower cross-subject overlap. Right: Group average cortical myelin map (from 196 HCP subjects) with a yellow/orange/red hotspot indicating the MT+ complex and retinotopic areal Maximum Probability Maps (MPMs) (from 12 non-HCP subjects) both registered using arealfeature-based surface registration and ‘de-drifted’ (see Supplementary Topic #13) (adapted from ref.). As shown in Supplementary Fig. 10, the white dots represent a contour along which functional connectivity rapidly changes that aligns with the border between retinotopic areas MT and pMST from a separate study. This is an example of the more conclusive cross-study, cross-modal boundary comparisons made possible by the HCP-style analysis paradigm. Data at http://balsa.wustl.edu/kNpD.

References

    1. Behrens TE & Sporns O Human connectomics. Current opinion in neurobiology 22, 144–153, doi:10.1016/j.conb.2011.08.005 (2012). - DOI - PMC - PubMed
    1. Jbabdi S, Sotiropoulos SN, Haber SN, Van Essen DC & Behrens TE Measuring macroscopic brain connections in vivo. Nature neuroscience 18, 1546–1555, doi:10.1038/nn.4134 (2015). - DOI - PubMed
    1. Smith SM Introduction to the Neuroimage Special Issue “Mapping the Connectome”. Neuroimage 80, 1 (2013). - PubMed
    1. Van Essen DC et al. The WU-Minn Human Connectome Project: an overview. Neuroimage 80, 62–79, doi:10.1016/j.neuroimage.2013.05.041 (2013). - DOI - PMC - PubMed
    1. Ugurbil K et al. Pushing spatial and temporal resolution for functional and diffusion MRI in the Human Connectome Project. Neuroimage 80, 80–104, doi:10.1016/j.neuroimage.2013.05.012 (2013). - DOI - PMC - PubMed

Publication types