. 2016 Oct;48(10):1260-6.
doi: 10.1038/ng.3650. Epub 2016 Aug 29.

Noncoding somatic and inherited single-nucleotide variants converge to promote ESR1 expression in breast cancer

Affiliations

Noncoding somatic and inherited single-nucleotide variants converge to promote ESR1 expression in breast cancer

Swneke D Bailey et al. Nat Genet. 2016 Oct.

Abstract

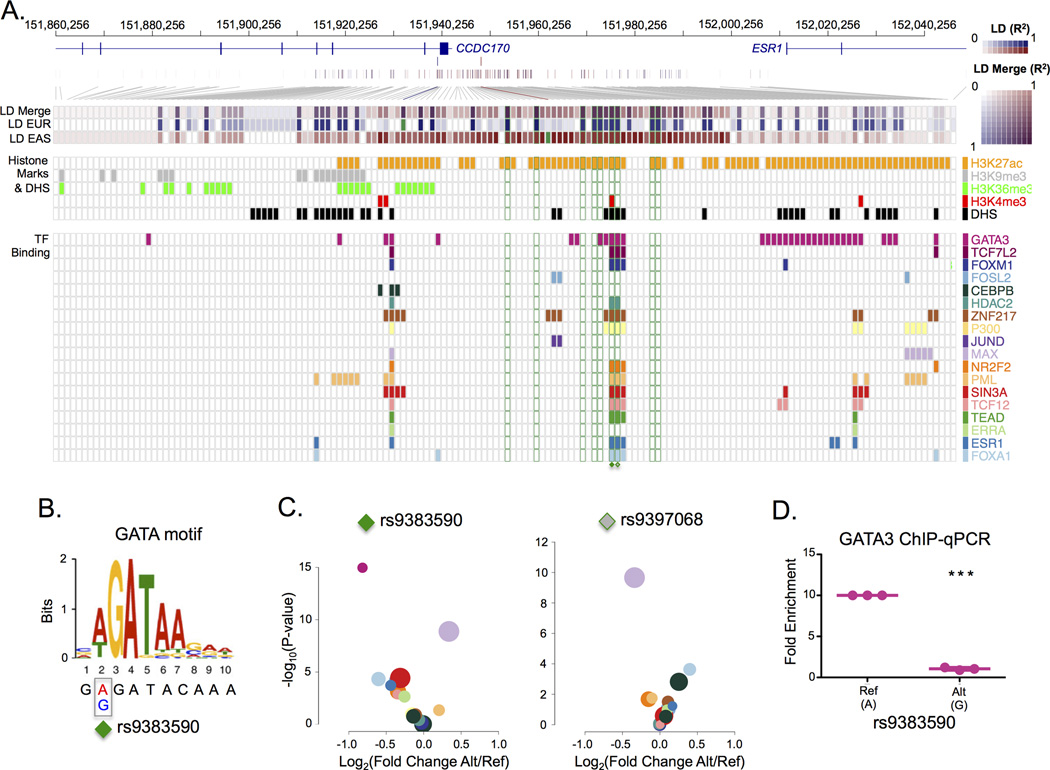
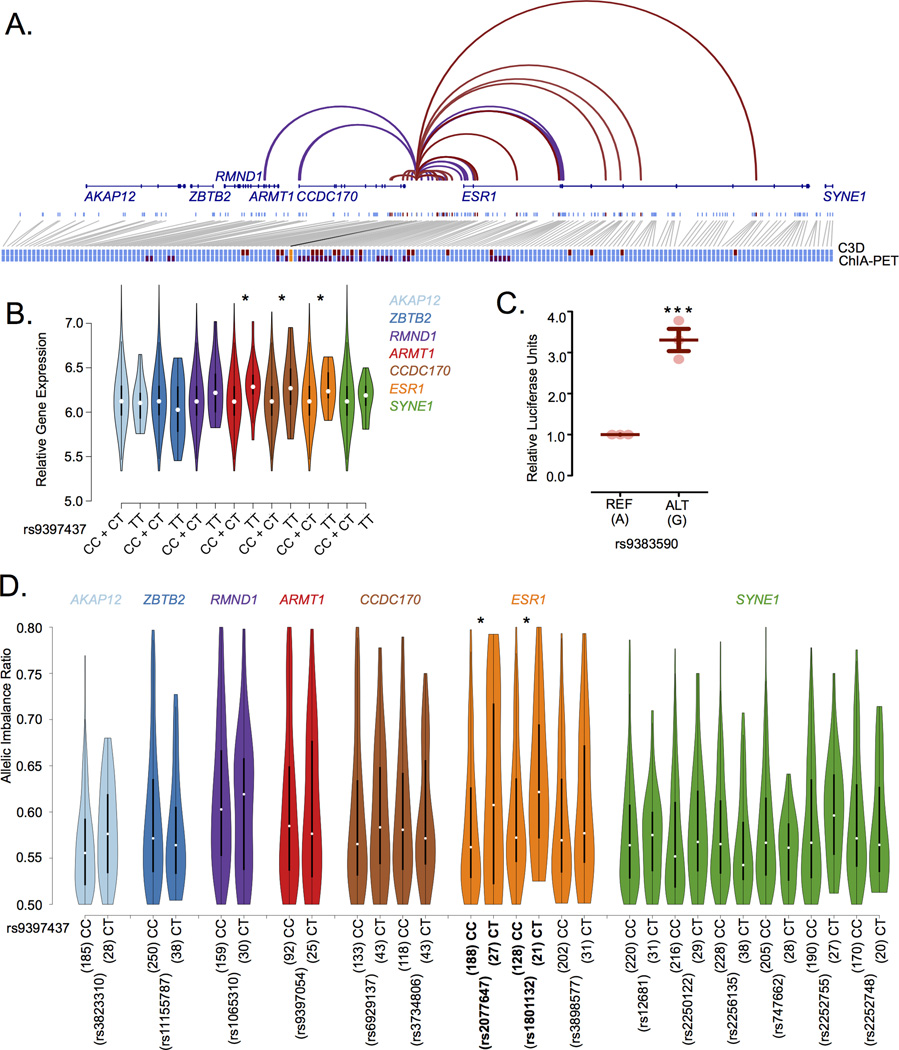
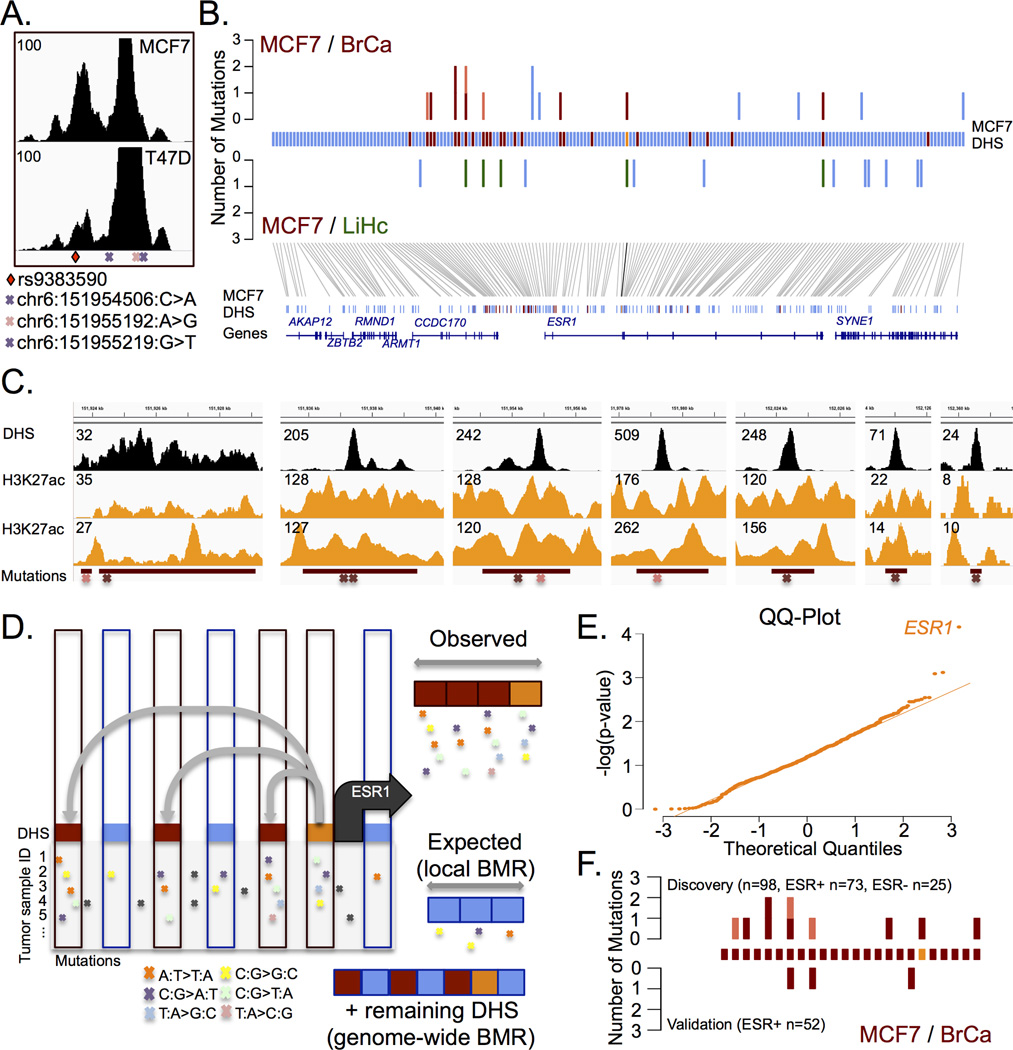
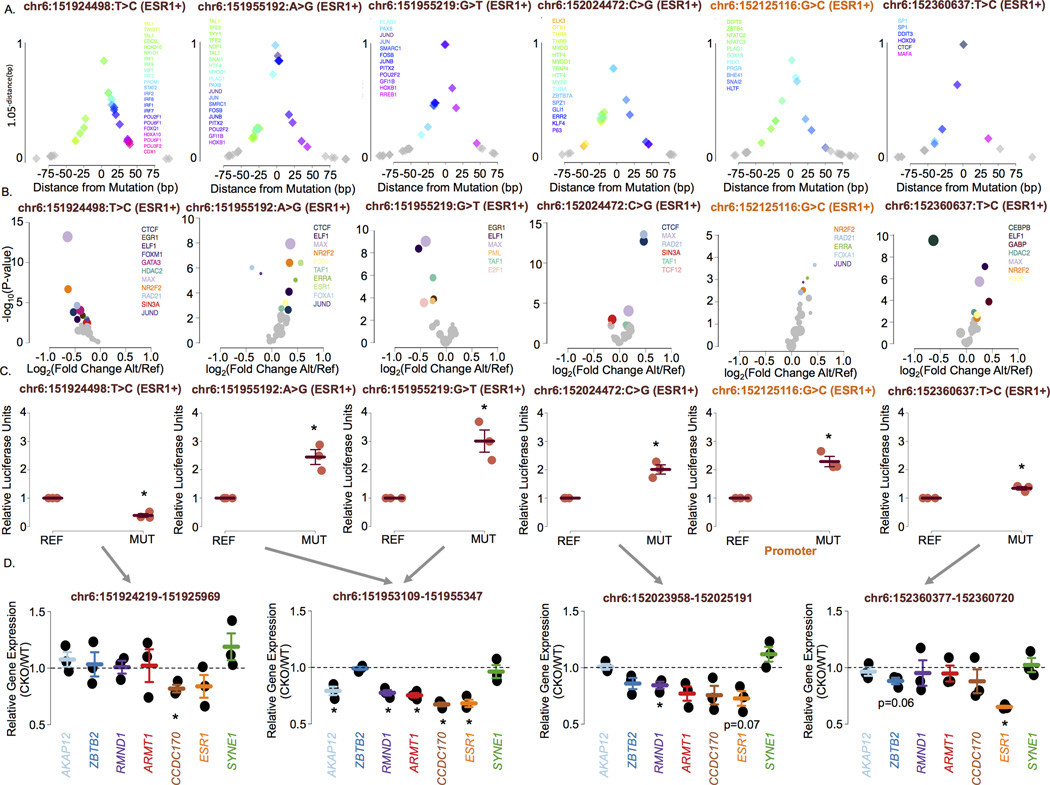
Sustained expression of the estrogen receptor-α (ESR1) drives two-thirds of breast cancer and defines the ESR1-positive subtype. ESR1 engages enhancers upon estrogen stimulation to establish an oncogenic expression program. Somatic copy number alterations involving the ESR1 gene occur in approximately 1% of ESR1-positive breast cancers, suggesting that other mechanisms underlie the persistent expression of ESR1. We report significant enrichment of somatic mutations within the set of regulatory elements (SRE) regulating ESR1 in 7% of ESR1-positive breast cancers. These mutations regulate ESR1 expression by modulating transcription factor binding to the DNA. The SRE includes a recurrently mutated enhancer whose activity is also affected by rs9383590, a functional inherited single-nucleotide variant (SNV) that accounts for several breast cancer risk-associated loci. Our work highlights the importance of considering the combinatorial activity of regulatory elements as a single unit to delineate the impact of noncoding genetic alterations on single genes in cancer.


Figures

Figure 1
Figure 1. Identification of a functional risk-associated SNV shared between Europeans and East Asians
A) The shared linkage disequilibrium (LD) between the European and East Asian lead SNVs. The composite strength of the LD (LD Merge) for the European and East Asian lead SNVs is shown (purple). The European LD (LD EUR) pattern for the rs3734805 SNV (blue) and the East Asian LD (LD EAS) pattern for rs2046210 SNV (red) are shown. The squares corresponding to the population-specific lead SNVs (rs3734805 and rs2046210) are filled in green. The 9 LD SNVs with an r2 ≥ 0.8 with both the European lead SNV and the East Asian lead SNV are outlined in green boxes. The overlapping functional annotations (DHS, histones modifications and transcription factor binding) observed in breast cancer cells (MCF-7 or T-47D) profiled by the ENCODE project are represented as boxes coloured according to the legend (right). B) Location of the rs9383590 SNV within the GATA3 DNA recognition motif. C) A volcano plot of the IGR results for all transcription factors overlapping rs9383590 and rs9397068 in (A). Transcription factors are coloured according to the legend in (A). The area of the circle is proportional to the maximum average signal intensity of the two alleles. D) Allele-specific ChIP-qPCR for GATA3 produced by the rs9383590 SNV. Statistical significance was determined with a one-sample t-test. Reported p-values are two-sided. The mean and standard error of the mean are shown.
Figure 2
Figure 2. The rs9383590 SNV interacts with the ESR1 promoter altering gene expression
A) Cross-Cell Type Correlation in DNaseI Hypersensitivity (C3D) predicted (red) and POL2 ChIA-PET determined (purple) chromatin interactions between the breast cancer risk-locus enhancer DHS and neighbouring DHS sites are shown. Single DHS resolution is presented for the C3D approach. All DHSs within a paired-end tag are considered as interacting in ChIA-PET data. DHS sites with no evidence of a chromatin interaction are also shown (light blue). The position of nearby genes (dark blue) is also shown. All DHSs interacting with the breast cancer risk-locus enhancer (orange) either predicted (red) or experimentally determine (purple) are enlarge to reveal the overlap at the bottom of the figure. B) Violin plots of the gene expression values for the genes at the ESR1 locus by rs9397437, a proxy of rs9383590, genotypes. Statistical significance was determined using linear regression under a recessive model C) Reporter assay results for the rs9383590 SNV. Statistical significance was determined with a one-sample t-test. D) Allelic imbalance of the genes at the ESR1 locus among TCGA breast tumours profiled by RNA-Seq. The allelic imbalance ratio represents the frequency of the most abundant allele within the RNA-Seq reads. Statistical significance was determined with an approximate Fisher-Pitman test using 10,000 permutations. All reported p-values are two-sided. Lines indicate the mean and the standard error of the mean. *,**,*** denotes the level of significance, a p-value less than 0.05, 0.01 and 0.005, respectively.
Figure 3
Figure 3. The set of regulatory elements (SRE) of ESR1 is targeted by acquired somatic mutations in breast cancer
A) DNAse-seq signal across the enhancer harbouring the rs9383590 SNV and three somatic mutations. Two identified in the discovery set of breast tumours cohort and one in the validation set of breast tumours. B) The top panel reveals the enrichment of mutations with DHS sites that interact (red) or not (blue) with the ESR1 promoter (orange) in breast tumours (BrCa). The number of mutations identified in ESR1-positive (red) and ESR1-negative samples (pink) are shown. The lack of enrichment within the SRE for mutations from liver tumours (LiHc) is also shown (green). C) The DNAse-Seq and H3K27ac ChIP-Seq signal profiles (from ENCODE and Taberlay et al.) for each of the regulatory elements harbouring a somatic mutation in breast tumours. D) Schematic representation of the mutational significance within ESR1’s SRE (MuSE) approach. C3D predicted (grey lines) DHS interacting (red rectangle) with the ESR1 gene promoter (orange rectangle) and non-interacting DHS (blue rectangle) are shown. The mutational load in the interacting versus non-interacting DHS define the observed versus expected mutational rate in ESR1’s SRE. E) A QQ-Plot of the observed −log(p-values) for the mutational significance of all SREs defined using MCF-7 cells (r≥0.9). F). The mutational burden within the ESR1 (±250kb) SRE for the discovery (top) and validation (bottom) samples, the enhancers are rank according to panel (C). Red indicates mutations found in ESR1-positive tumours and pink indicates mutations found in ESR1-negative tumours.
Figure 4
Figure 4. Noncoding somatic mutations targeting ESR1 increase gene expression
A) Distance of the transcription factor DNA recognition motifs to the identified mutations. The y-axis is a function (1.05−distance) of the distance to each mutation to emphasize the closest motifs. This function has a range of 0 – 1 within 100bp of the mutation. Each diamond represents the location of a transcription factor DNA recognition motif. B) Volcano plots presenting the p-value versus the fold change in chromatin binding intensity predicted by the intra-genomic replicates (IGR) analysis for transcription factors for each mutation in the ESR1’s SRE. All transcription factors profiled by ChIP-seq in MCF-7 or T-47D by ENCODE were tested for each mutation. Only those whose binding intensity for the chromatin is predicted to be modulated by the mutations (p<0.005) are coloured. Others are grey. C) Reporter assays revealing the impact of six mutations targeting the ESR1 SRE in ESR1-positive breast tumours on gene expression. Error bars indicate the standard error of the mean. D) Gene expression levels assessed by RT-qPCR in wild-type T-47D (WT) and T-47D cells with a CRISPR/Cas9-based deletion of the respective enhancer (CKO) region. All reported p-values are two-sided. * denotes significant (p<0.05).

References

    1. Green KA, Carroll JS. Oestrogen-receptor-mediated transcription and the influence of co-factors and chromatin state. Nat Rev Cancer. 2007;7:713–722. - PubMed
    1. Vincent-Salomon A, Raynal V, Lucchesi C, Gruel N, Delattre O. ESR1 gene amplification in breast cancer: a common phenomenon? Nat Genet. 2008;40:809. author reply 810-2. - PubMed
    1. Brown LA, et al. ESR1 gene amplification in breast cancer: a common phenomenon? Nat Genet. 2008;40:806–807. author reply 810-2. - PMC - PubMed
    1. Horlings HM, et al. ESR1 gene amplification in breast cancer: a common phenomenon? Nat Genet. 2008;40:807–808. author reply 810-2. - PubMed
    1. Reis-Filho JS, et al. ESR1 gene amplification in breast cancer: a common phenomenon? Nat Genet. 2008;40:809–810. author reply 810-2. - PubMed