. 2016 Nov;6(9):669-680.
doi: 10.1089/brain.2016.0435. Epub 2016 Sep 30.

Evaluation of Denoising Strategies to Address Motion-Correlated Artifacts in Resting-State Functional Magnetic Resonance Imaging Data from the Human Connectome Project

Affiliations

Evaluation of Denoising Strategies to Address Motion-Correlated Artifacts in Resting-State Functional Magnetic Resonance Imaging Data from the Human Connectome Project

Gregory C Burgess et al. Brain Connect. 2016 Nov.

Abstract

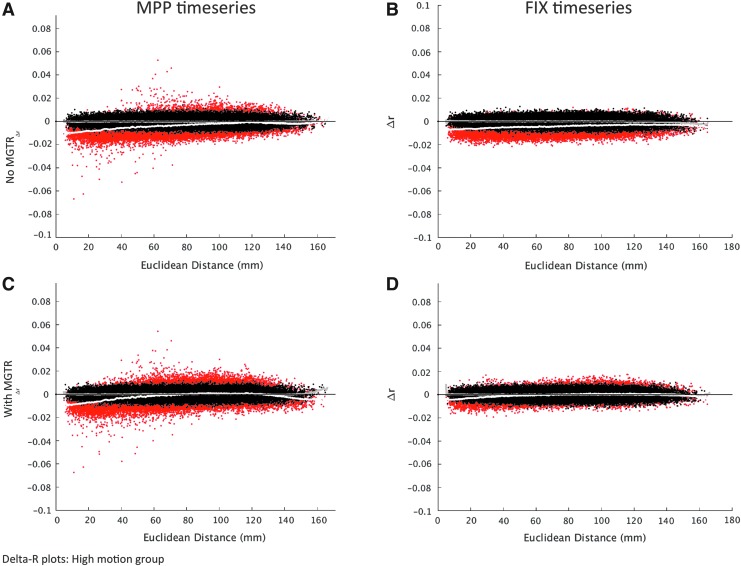
Like all resting-state functional connectivity data, the data from the Human Connectome Project (HCP) are adversely affected by structured noise artifacts arising from head motion and physiological processes. Functional connectivity estimates (Pearson's correlation coefficients) were inflated for high-motion time points and for high-motion participants. This inflation occurred across the brain, suggesting the presence of globally distributed artifacts. The degree of inflation was further increased for connections between nearby regions compared with distant regions, suggesting the presence of distance-dependent spatially specific artifacts. We evaluated several denoising methods: censoring high-motion time points, motion regression, the FMRIB independent component analysis-based X-noiseifier (FIX), and mean grayordinate time series regression (MGTR; as a proxy for global signal regression). The results suggest that FIX denoising reduced both types of artifacts, but left substantial global artifacts behind. MGTR significantly reduced global artifacts, but left substantial spatially specific artifacts behind. Censoring high-motion time points resulted in a small reduction of distance-dependent and global artifacts, eliminating neither type. All denoising strategies left differences between high- and low-motion participants, but only MGTR substantially reduced those differences. Ultimately, functional connectivity estimates from HCP data showed spatially specific and globally distributed artifacts, and the most effective approach to address both types of motion-correlated artifacts was a combination of FIX and MGTR.

Keywords: Human Connectome Project; artifact; denoising; fMRI; functional connectivity; independent component analysis; motion; resting state.


Conflict of interest statement

Author Disclosure Statement No competing financial interests exist.

Figures

<b>FIG. 1.</b>
FIG. 1.
Nature of blood oxygen level-dependent fluctuations in HCP data, and aspects removed by each denoising stage: Five residual grayordinate plots (in grayscale on left) show rfMRI data after each denoising stage: (A) MPP before motion regression, (B) MPP after motion regression, (C) FIX, (D) MPP+MGTR, and (E) FIX+MGTR. Four difference grayordinate plots (in color on right) show variance removed by specific denoising steps (estimated by subtracting the current preprocessing stage from a specified prior stage): (F) motion regression (A, B); (G) ICA denoising (B, C); (H) MGTR (B–D); and (J) ICA denoising plus MGTR (B–E). For each grayordinate plot, columns reflect time points and rows reflect grayordinates. Intensities are z-scored (across time, separately for each vertex) and range from −2 to +2. The top panel on both sides shows FD (red), with horizontal lines marking FD = 0.2 mm (suggested as a censoring threshold by Power et al., 2014) and FD = 0.39 mm (current study threshold for FD). MGT (black lines) and DVARS (blue lines) are derived from data after each denoising strategy. The horizontal line in (A) corresponds to the DVARS censoring threshold of 4.9 arbitrary MR units. Green arrows indicate time periods displaying the global artifact, which manifests as similar effects across space and occurs across most grayordinates. Spatially specific artifacts, which manifest as dissimilar effects across space, are indicated by red arrows (instances that occur at few grayordinates) and blue arrows (instances that occur across most grayordinates). FD, framewise displacement; FIX, FMRIB ICA-based X-noiseifier; HCP, Human Connectome Project; ICA, independent component analysis; MGTR, mean grayordinate time series regression; MPP, minimally preprocessed; rfMRI, resting-state functional magnetic resonance imaging.
<b>FIG. 2.</b>
FIG. 2.
Censoring high-motion time points reveals spatially specific and global shift artifacts in ΔR plots: Red cloud (and white loess fit line) shows effects of censoring high-motion time points on rsFC estimates in the high-motion group, plotted as the function of distance between parcels being correlated. Black cloud (and gray loess fit) shows positive control (censoring equal number of randomized time points). Range of ΔR (y-axis) from 0.1 to −0.1, following Power and associates (2014). Panels show effects of censoring on average rsFC estimates from high-motion group for (A) MPP, (B) FIX, (C) MPP+MGTR, and (D) FIX+MGTR time series data. Analogous plots for the low-motion group are in Supplementary Figure S1. rsFC, resting-state functional connectivity.
<b>FIG. 3.</b>
FIG. 3.
QC-rsFC plots show the correlation across participants between the rsFC estimates after censoring and degree of head motion (quantified by proportion of time points censored using the combined FD and DVARS criteria). The QC-rsFC relationship is plotted for each of the 61,776 connections as a function of the distance between parcels for (A) MPP, (B) FIX, (C) MPP+MGTR, and (D) FIX+MGTR time series data. Analogous plots for uncensored data are in Supplementary Figure S2. QC, quality control.

References

    1. Behzadi Y, Restom K, Liau J, Liu TT. 2007. A component based noise correction method (CompCor) for BOLD and perfusion based fMRI. NeuroImage 37:90–101 - PMC - PubMed
    1. Birn RM, Diamond JB, Smith MA, Bandettini PA. 2006. Separating respiratory-variation-related fluctuations from neuronal-activity-related fluctuations in fMRI. NeuroImage 31:1536–1548 - PubMed
    1. Birn RM, Smith MA, Jones TB, Bandettini PA. 2008. The respiration response function: The temporal dynamics of fMRI signal fluctuations related to changes in respiration. NeuroImage 40:644–654 - PMC - PubMed
    1. Carp J. 2013. Optimizing the order of operations for movement scrubbing: Comment on Power et al. NeuroImage 76:436–438 - PubMed
    1. Chai XJ, Castañón AN, Öngür D, Whitfield-Gabrieli S. 2012. Anticorrelations in resting state networks without global signal regression. NeuroImage 59:1420–1428 - PMC - PubMed

Publication types

LinkOut - more resources