. 2016 Oct;22(10):1160-1169.
doi: 10.1038/nm.4162. Epub 2016 Aug 29.

Implant-derived magnesium induces local neuronal production of CGRP to improve bone-fracture healing in rats

Affiliations

Implant-derived magnesium induces local neuronal production of CGRP to improve bone-fracture healing in rats

Yifeng Zhang et al. Nat Med. 2016 Oct.

Abstract

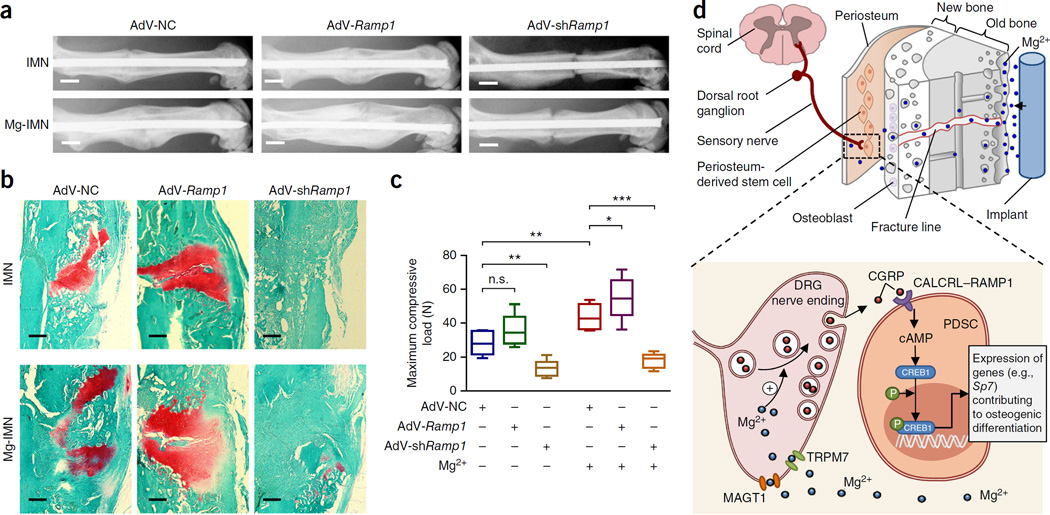
Orthopedic implants containing biodegradable magnesium have been used for fracture repair with considerable efficacy; however, the underlying mechanisms by which these implants improve fracture healing remain elusive. Here we show the formation of abundant new bone at peripheral cortical sites after intramedullary implantation of a pin containing ultrapure magnesium into the intact distal femur in rats. This response was accompanied by substantial increases of neuronal calcitonin gene-related polypeptide-α (CGRP) in both the peripheral cortex of the femur and the ipsilateral dorsal root ganglia (DRG). Surgical removal of the periosteum, capsaicin denervation of sensory nerves or knockdown in vivo of the CGRP-receptor-encoding genes Calcrl or Ramp1 substantially reversed the magnesium-induced osteogenesis that we observed in this model. Overexpression of these genes, however, enhanced magnesium-induced osteogenesis. We further found that an elevation of extracellular magnesium induces magnesium transporter 1 (MAGT1)-dependent and transient receptor potential cation channel, subfamily M, member 7 (TRPM7)-dependent magnesium entry, as well as an increase in intracellular adenosine triphosphate (ATP) and the accumulation of terminal synaptic vesicles in isolated rat DRG neurons. In isolated rat periosteum-derived stem cells, CGRP induces CALCRL- and RAMP1-dependent activation of cAMP-responsive element binding protein 1 (CREB1) and SP7 (also known as osterix), and thus enhances osteogenic differentiation of these stem cells. Furthermore, we have developed an innovative, magnesium-containing intramedullary nail that facilitates femur fracture repair in rats with ovariectomy-induced osteoporosis. Taken together, these findings reveal a previously undefined role of magnesium in promoting CGRP-mediated osteogenic differentiation, which suggests the therapeutic potential of this ion in orthopedics.


Figures

Figure 1
Figure 1
Periosteum-dependent new-bone formation induced by magnesium in rat femur. (a) Representative H&E staining (top) and calcein-green labeling (bottom) for new bone in the mid-shaft of rat femora intramedullary implanted with a magnesium (Mg2+) or stainless steel (as control (Ctrl)) rod for 2 weeks (n = 6 images per group). P, periosteum; BM, bone marrow; OB, old bone; NB, new bone. Scale bars, 200 µm. (b,c) Representative micro-CT images (b, n ≥ 7 images per group) and corresponding measurements (c) of total bone TV, high-density BV and ρMOI in rat femora implanted with Mg2+ or Ctrl rods, or denuded of the periosteum with magnesium implantation (Mg2+ minus periosteum). ***P < 0.001 by one-way ANOVA with Tukey’s post hoc test. Parenthetic numbers indicate n value for each group. Scale bars, 1 mm. Stainless-steel implants were removed from the bone before micro-CT to avoid scanning artifact. (d,e) Representative radiographs (d, n ≥ 6 images per group) and micro-CT measurements of TV, BV and BMD (e) in rat femora 2 weeks after Mg2+ or Ctrl implantation with or without capsaicin treatment (see Online Methods). *P < 0.05, ***P < 0.001 by one-way ANOVA with Tukey’s post hoc test. n is shown for each group in parentheses. Scale bars, 5 mm. mg HA/cm3, unit of hydroxyapatite density. (f) Representative immunofluorescence labeling (top, n = 1 image from each of three rats per group used) and ELISA analysis (bottom) for CGRP in rat femora 2 weeks after implantation. Arrowheads indicate CGRP-positive area. **P < 0.01, ***P < 0.001 by two-way ANOVA with Bonferroni post hoc test, n = 3 biological replicates. Scale bars, 50 µm. (g) Representative images of immunofluorescence staining (n = 1 image from each of three rats per group used) for CGRP in DRGs in L4 lumbar from rats at 2 weeks after implantation. Lower images are high-resolution versions of the boxed regions in the upper images. Nuclei are labeled with DAPI. Scale bars, 50 µm. Data throughout are means ± s.e.m.
Figure 2
Figure 2
Role of CGRP receptor in magnesium-induced new-bone formation in rat femur. (a–c) Representative radiographs (a, n = 1 image from each of four rats per group used), calcein/xylenol assessment of bone remodeling (b, n = 1 image from each of four rats per group used) and micro-CT measurements of BV, TV and BMD (c) in rat femora 2 weeks after Mg2+ or Ctrl implantation, with pretreatment with adenoviruses conjugated with Calcrl cDNA (AdV-Calcrl) or shRNA targeting Calcrl (AdV-shCalcrl) to overexpress or knockdown Calcrl, respectively. Adenovirus with scrambled sequence was used as the negative control (AdV-NC). *P < 0.05, **P < 0.01, ***P < 0.001, n.s., P > 0.05 by one-way ANOVA with Newman–Keuls post hoc test. n = 4 animals per group. Scale bars, 5 mm (a) and 1 mm (b). (d,e) Representative calcein-green labeling for new bone (d, n = 6 images per group) and micro-CT measurements of BV, TV and BMD (e) in rat femora 2 weeks after Mg2+ or Ctrl implantation with the pretreatment of adenoviruses conjugated with Ramp1 cDNA (AdV-Ramp1), shRNA targeting Ramp1 (AdV-shRamp1) or AdV-NC, respectively. *P < 0.05, **P < 0.01, ***P < 0.001, n.s., P > 0.05 by one-way ANOVA with Newman–Keuls post hoc test. n = 6 animals per group. Scale bars, 500 µm (d). Data throughout are means ± s.e.m.
Figure 3
Figure 3
Effect of Mg2+ on rat DRG neurons in vitro. (a) Representative bright-field photograph of DRG neurons isolated from rats (n = 10 images). Arrows indicate large phase-bright DRG neurons. Scale bar, 100 µm. (b) Fluorescence labeling for CGRP (red) and neuronal vesicles with FM1-43 (green) in cultured DRG neurons. Scale bar, 20 µm. (c) Confocal live-cell imaging (left) of DRG neurons pre-loaded with FM1-43 in Mg2+-free bath (at 0 and 5 min) and after the addition of MgCl2 (1–2 mM) (at 7.5, 10, 12.5 and 15 min). Arrowheads indicate neuronal terminus. Corresponding quantification (right) of FM1-43 intensity at neuronal terminus. **P < 0.01 by one-way ANOVA with Tukey’s post hoc test, n = 5 cells per group. Scale bar, 10 µm. (d) Representative confocal images (left, n = 5 images per group) and corresponding quantification (right) of FM1-43-loaded DRG neurons treated with cytochalasin B (CB, 20 µM), an inhibitor of actin polymerization, and subsequently, MgCl2 (2 mM). n.s., P > 0.05 by one-way ANOVA with Tukey’s post hoc test, n = 5 cells per group. Scale bar, 10 µm. (e) Measurement of intracellular ATP concentration in DRG neurons after incubation with different concentrations of Mg2+ for 24 h. **P < 0.01, ***P < 0.001 by one-way ANOVA with Tukey’s post hoc test, n = 6 culture wells of cells for biological replicates. (f) Mg-Fura2 detection of Mg2+-entry into DRG neurons. Representative fluorescence photographs (excited at 340 nm) (left) of DRG neurons before (top) and after (bottom) the addition of MgCl2 (10 mM) into Mg2+-free bath (n ≥ 10 images per condition). Color ranges from low (black to purple) to high (red to white) levels of Mg2+. Insets show high magnification of circled area. Time-course changes (right) in intracellular Mg2+ levels (indicated by 340/380 ratio of Mg-Fura2) in DRG neurons in the absence or presence of nitrendipine (50 µM, inhibiting MAGT1), 2-APB (100 µM, inhibiting TRPM7) or ruthenium red (50 µM, inhibiting TRPM6 and TRPV) before and after the addition of MgCl2 (10 mM) into the Mg2+-free buffer. ***P < 0.001 by one-way ANOVA with Tukey’s post hoc test; n is shown in parentheses in each column. Scale bars, 20 µm (main images); 5 µm (inserts). Data throughout are means ± s.e.m.
Figure 4
Figure 4
CGRP promotes osteogenic differentiation of periosteum-derived stem cells (PDSCs). (a) Confocal images of FITC-labeled peripheral cortex of cortical bone (outer layer) in rat femora implanted for 2 weeks with Mg2+ or Ctrl rods (n = 1 image from each of four rats used). Scale bars, 100 µm. (b) Alizarin red (AR) and alkaline phosphatase (ALP) staining in PDSCs isolated from rat femora implanted for 2 weeks with Mg2+ or Ctrl rods, or nonimplanted ones as the blank control (Blk). Scale bars, 5 mm. (c) 3-(4,5-dimethylthiazol-2-yl)-2,5-diphenyltetrazolium bromide (MTT) assay of PDSCs isolated from nonimplanted rat femora after 72-h incubation period with CGRP (0–10−8 M). (d) Real-time PCR analysis of Alp, osteocalcin (Bglap) and osteopontin (Opn) mRNA expression in the PDSCs after a 2-week incubation period with CGRP. In c, n = 8 biological replicates, and in d, n = 3 biological replicates. *P < 0.05, **P < 0.01 and ***P < 0.001, as compared to cells in the absence of CGRP, by one-way ANOVA with Dunnett’s post hoc test. Data are means ± s.e.m. Shapes of circle, square, triangle and del operator represent the addition, respectively, of 0, 10−12, 10−10 or 10−8 M CGRP. (e,f) AR and ALP staining (e) and representative western blotting (n = 3 experiments) for CALCRL, pCREB1, RUNX2 and SP7 (f, n = 3 western blots per condition) in the PDSCs transfected with (+) or without (–) AdV-Calcrl, AdV-shCalcrl or AdV-NC in absence (–) or presence (+) of CGRP (10−10 M). Mr, marker. Scale bars, 5 mm. (g) ALP and AR staining in the PDSCs after 14-d incubation with condition media, which were collected from DRG neuron cultures in absence (NM-Ctrl) or presence of Mg2+ (NM-Mg2+) (see Methods). Scale bars, 5 mm.
Figure 5
Figure 5
Innovative magnesium-containing intramedullary nail accelerates fracture healing of femoral shaft in rats with ovariectomy-induced osteoporosis. (a,b) Representative radiographs (a, n ≥ 5 images per group) and quantification of the area and width (b) of the fracture callus in rat femora 2–12 weeks after implantation with IMN or Mg-IMN. *P < 0.05, ***P < 0.001 by two-way ANOVA with Bonferroni post hoc test. n is shown in parentheses for each group. Scale bars, 5 mm. (c) Micro-CT measurements of TV, BV, BV/TV and TV density of fractured rat femora 2–12 weeks after IMN or Mg-IMN implantation. *P < 0.05, ***P < 0.001 by two-way ANOVA with Bonferroni post hoc test. n is shown in parentheses for each group. (d) Biomechanical test of maximum compressive load of the fractured rat femora 12 weeks after IMN or Mg-IMN implantation. *P < 0.05 by Student’s t test. n is shown in parentheses for each group. (e,f) Representative images of H&E staining (e, n = 1 image from each of four rats per group) and polarized light analysis (f, n = 1 image from each of four rats per group) in mid-sagittal section of the fracture callus 2–12 weeks after implantation of IMN or Mg-IMN with quantitation (right) of bone (e) and cartilaginous (f) fractions. n = 4 animals per group; *P < 0.05, by two-way ANOVA with Bonferroni post hoc test. Scale bars, 500 µm. (g) Bone-remodeling assessment by calcein/xylenol double-labeling (n = 1 image from each of four rats per group) in rat femora 4–12 weeks after implantation with IMN or Mg-IMN. Scale bars, 5 mm. (h) Rate of bone remodeling is indicated by xylenol/calcein intensity ratios (top, week 4 data; middle, week 8 data; bottom, week 12 data). n = 4 samples per group, *P < 0.05, ***P < 0.001 by Student’s t test. Data are means ± s.e.m.
Figure 6
Figure 6
Role of CGRP receptor in the beneficial effect of Mg-IMN on bone-fracture healing in rats. (a–c) Radiographs (a), safranin O staining (b) and biomechanical test of maximum compressive load (c) of the fractured rat femora 4 weeks after implantation with IMN or Mg-IMN in conjunction with treatment of AdV-NC, AdV-Ramp1 or AdV-shRamp1. n = 6 animals per group. *P < 0.05, **P < 0.01, ***P < 0.001, n.s., P > 0.05 by one-way ANOVA with Newman-Keuls post hoc test. Data are presented as means ± s.e.m. Scale bars, 5 mm (a) and 200 µm (b). Images are representative of six images taken from each group. (d) Schematic diagram showing diffusion of implant-derived Mg2+ across the bone toward the periosteum that is innervated by DRG sensory neurons and enriched with PDSCs undergoing osteogenic differentiation into new bone (top). Inset (shown enlarged at bottom), the released Mg2+ enters DRG neurons via Mg2+ transporters or channels (i.e., MAGT1 and TRPM7) and promotes CGRP-vesicles accumulation and exocytosis. The DRG-released CGRP, in turn, activates the CGRP receptor (consisting of CALCRL and RAMP1) in PDSCs, which triggers phosphorylation of CREB1 via cAMP and promotes the expression of genes contributing to osteogenic differentiation.

Comment in

References

    1. Cheung WH, Chin WC, Qin L, Leung KS. Low intensity pulsed ultrasound enhances fracture healing in both ovariectomy-induced osteoporotic and age-matched normal bones. J. Orthop. Res. 2012;30:129–136. - PubMed
    1. Hayes JS, Richards RG. The use of titanium and stainless steel in fracture fixation. Expert Rev. Med. Devices. 2010;7:843–853. - PubMed
    1. Gu XN, Xie XH, Li N, Zheng YF, Qin L. In vitro and in vivo studies on a Mg-Sr binary alloy system developed as a new kind of biodegradable metal. Acta Biomater. 2012;8:2360–2374. - PubMed
    1. de Baaij JH, Hoenderop JG, Bindels RJ. Magnesium in man: implications for health and disease. Physiol. Rev. 2015;95:1–46. - PubMed
    1. Li FY, et al. Second messenger role for Mg2+ revealed by human T-cell immunodeficiency. Nature. 2011;475:471–476. - PMC - PubMed

MeSH terms