. 2016 Oct 3;126(10):3758-3771.
doi: 10.1172/JCI84440. Epub 2016 Aug 29.

LYN- and AIRE-mediated tolerance checkpoint defects synergize to trigger organ-specific autoimmunity

LYN- and AIRE-mediated tolerance checkpoint defects synergize to trigger organ-specific autoimmunity

Irina Proekt et al. J Clin Invest. .

Abstract

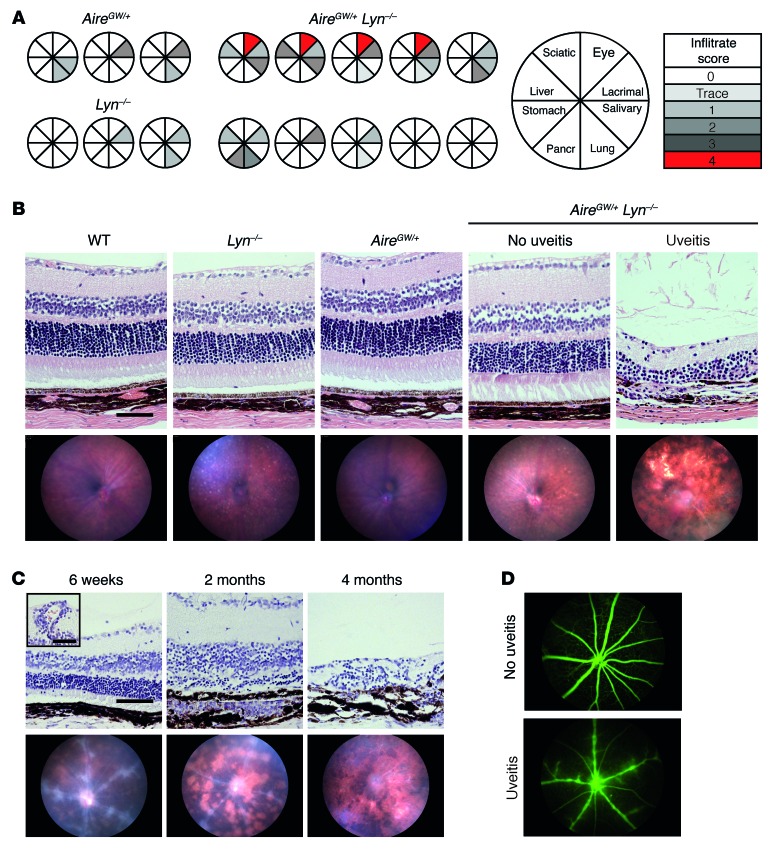
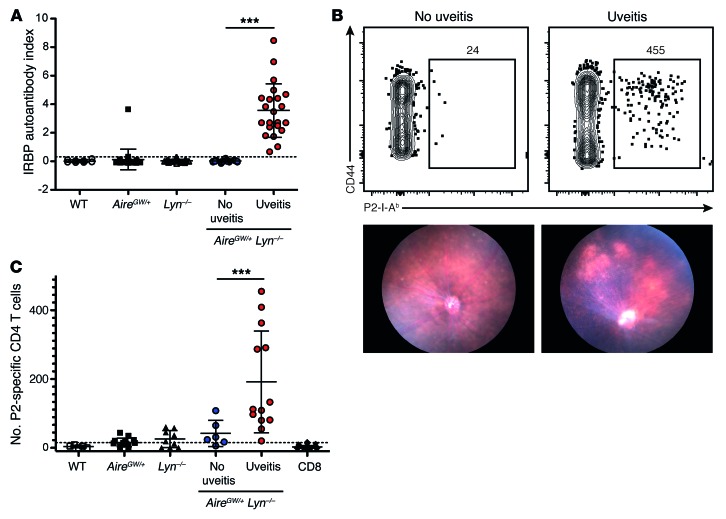
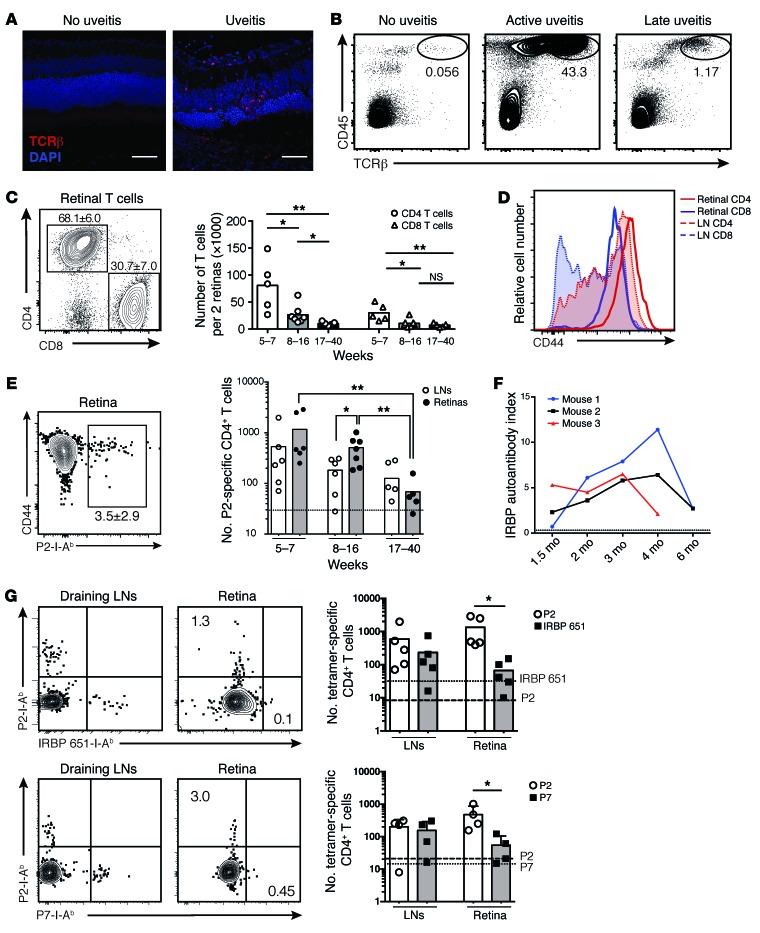
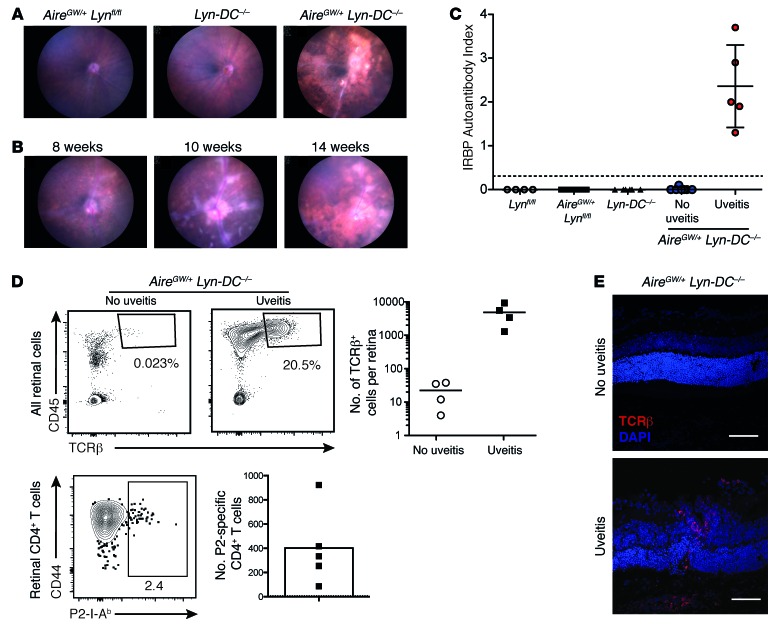
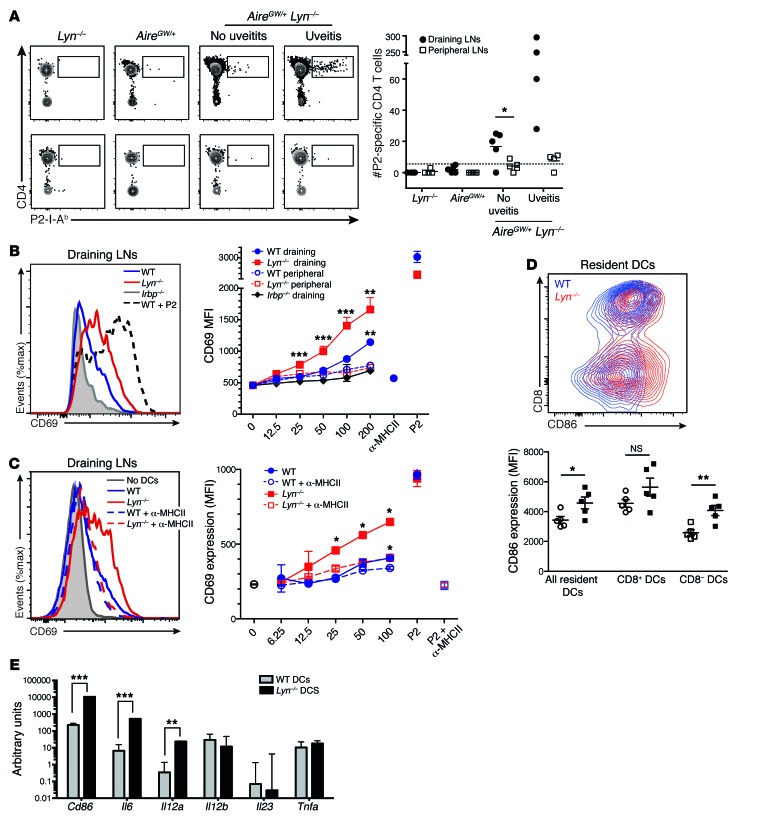
Studies of the genetic factors associated with human autoimmune disease suggest a multigenic origin of susceptibility; however, how these factors interact and through which tolerance pathways they operate generally remain to be defined. One key checkpoint occurs through the activity of the autoimmune regulator AIRE, which promotes central T cell tolerance. Recent reports have described a variety of dominant-negative AIRE mutations that likely contribute to human autoimmunity to a greater extent than previously thought. In families with these mutations, the penetrance of autoimmunity is incomplete, suggesting that other checkpoints play a role in preventing autoimmunity. Here, we tested whether a defect in LYN, an inhibitory protein tyrosine kinase that is implicated in systemic autoimmunity, could combine with an Aire mutation to provoke organ-specific autoimmunity. Indeed, mice with a dominant-negative allele of Aire and deficiency in LYN spontaneously developed organ-specific autoimmunity in the eye. We further determined that a small pool of retinal protein-specific T cells escaped thymic deletion as a result of the hypomorphic Aire function and that these cells also escaped peripheral tolerance in the presence of LYN-deficient dendritic cells, leading to highly destructive autoimmune attack. These findings demonstrate how 2 distinct tolerance pathways can synergize to unleash autoimmunity and have implications for the genetic susceptibility of autoimmune disease.


Figures

Figure 1
Figure 1. AireGW/+ Lyn–/– double-mutant mice develop progressive posterior uveitis.
(A) Eight- to 10-month-old AireGW/+ Lyn–/– (n = 10), AireGW/+ (n = 4), or Lyn–/– (n = 6) mice were analyzed by scoring of H&E-stained histological sections for presence of inflammatory infiltrates in a panel of organs consisting of eye, lacrimal gland, salivary gland, lung, pancreas, stomach, liver, and sciatic nerve. Pie graphs represent individual mice, with shaded sections indicating the presence of mononuclear infiltrate in the designated organ. The degree of shading reflects the severity of autoimmune damage, as indicated. The characteristics of all 10 double-mutant mice are shown, whereas 3 representative examples of each single-mutant mouse strain are shown. (B) Representative funduscopic images (bottom row) or H&E-stained retinal sections (top row; original magnification, ×20; scale bar: 100 μm) from 5-month-old AireGW/+ Lyn–/– mice with and without uveitis and WT, AireGW/+, and Lyn–/– mice. (C) Time course of histological (top row; original magnification, ×20; scale bar: 100 μm) and funduscopic (bottom row) changes in AireGW/+ Lyn–/– mice with uveitis. Early changes consisted of swelling of retinal vessels and perivascular exudates (inset; original magnification, ×20; scale bar: 50 μm) leading to infiltration of mononuclear cells, development of inflammatory lesions, and destruction of the photoreceptor layer. Advanced disease was characterized by extensive retinal destruction and scarring. (n = 3 mice with uveitis analyzed longitudinally.) (D) Representative fluorescein imaging of retinal vessels in healthy (top) and diseased (bottom) 7-week-old AireGW/+ Lyn–/– mice. (At least 3 mice per group were analyzed.)
Figure 2
Figure 2. Presence of anti-IRBP antibodies and IRBP-reactive T cells in AireGW/+ Lyn–/– mice with uveitis.
(A) The sera of 2- to 6-month-old AireGW/+ Lyn–/– mice with (n = 14) and without (n = 9) uveitis, or of WT (n = 8), AireGW/+ (n = 36), or Lyn–/– (n = 31) mice, were analyzed for the presence of anti-IRBP antibodies with a radioligand binding assay and normalized to a commercially available anti-IRBP antibody to determine autoantibody index (AI). Each dot represents an individual mouse, and the horizontal lines show mean ± SD. The dashed line represents the limit of detection, calculated as an average of AI values for all WT samples plus 3 SDs. (B) Representative flow cytometric analysis of IRBP P2 tetramer–binding CD4 T cells in pooled spleen and cervical lymph nodes (top) and funduscopy (bottom) from 2- to 5-month-old AireGW/+ Lyn–/– mice with and without uveitis. Plots were pregated for CD4+ T cells as described in Methods. The calculated total number of tetramer-positive cells in the whole sample is shown on the plot. (C) Numbers of P2-specific CD3+ CD4 T cells gated as in B from individual AireGW/+ Lyn–/– mice with and without uveitis, and from WT and single-mutant control mice. Each dot represents an individual mouse, and the horizontal lines show mean ± SD. The dashed line represents the limit of detection, calculated as average number of P2-binding CD3+CD8+ T cells plus 3 SDs. Data are pooled from 3 to 5 independent experiments. ***P < 0.001, 1-way ANOVA.
Figure 3
Figure 3. Activated IRBP-specific T cells infiltrate the retinas of AireGW/+ Lyn–/– mice with uveitis.
(A) Immunostaining of retinas from AireGW/+ Lyn–/– mice showing infiltration of TCRβ+ T cells (red) in mice with uveitis (original magnification, ×40; scale bars: 50 μm). Data are representative of 2 independent experiments. (BE) Analysis of total and IRBP-specific T cells in mice with uveitis. Plots are representative of 3 independent experiments with n = 3–5 mice per group; numbers shown indicate percentage of cells in gate. Graphs show data pooled from 3 independent experiments; each dot represents an individual mouse; bars represent mean. (B) CD45 and TCRβ expression on total live retinal cells. (C) CD4 and CD8 expression on CD45+TCRβ+ retinal T cells (left), and numbers of these cells in the retinas of mice of indicated ages (right). (D) CD44 expression on CD4+ and CD8+ T cells from indicated tissue. LN, lymph node. (E) Left: Frequency of retinal P2 tetramer–specific CD4+ T cells from mice in C. Right: Numbers of P2-specific cells in indicated tissue. Dashed line represents the limit of detection. (F) Anti-IRBP antibodies in the serum of AireGW/+ Lyn–/– mice with uveitis analyzed longitudinally. Dashed line represents the limit of detection. (G) Mice with active uveitis were analyzed for the presence of CD4+ T cells binding either P2 and IRBP 651–670 (“IRBP 651”; top) or P2 and P7 (bottom) epitopes of IRBP in the indicated tissue. Plots show representative costaining; numbers indicate percentage of cells in gate, quantified on the right. Each dot represents an individual mouse; bars show mean. Dashed line represents the limit of detection for the P2 tetramer; dotted line represents the limit of detection for the IRBP 651 (top) or P7 (bottom) tetramer. Data are pooled from 2 independent experiments. *P < 0.05, **P < 0.01, Mann-Whitney test (C, E, and G).
Figure 4
Figure 4. AireGW/+ Lyn-DC–/– mice develop uveitis that is accompanied by an anti-IRBP immune response.
(A) Representative funduscopic images of 3- to 6-month-old mice of indicated genotypes showing retinal disease in a subset of the AireGW/+ Lyn-DC–/– mice. (B) Time course of funduscopic changes in an AireGW/+ Lyn-DC–/– mouse with uveitis (representative of n = 3 mice with uveitis analyzed longitudinally). (C) Anti-IRBP antibody levels in the serum of 2- to 6-month-old AireGW/+ Lyn-DC–/– mice with (n = 5) and without uveitis (n = 7) were measured. Control mice analyzed consisted of Lynfl/fl (n = 8), AireGW/+ Lynfl/fl (n = 15), and Cd11c-Cre Lynfl/fl (n = 10). Each dot represents an individual mouse; the horizontal lines show mean ± SD; the dashed line represents the limit of detection. (D) Left set of panels: Plots of retinal cell populations from AireGW/+ Lyn-DC–/– mice with or without uveitis. Single-cell suspensions from retinas of individual mice were analyzed for CD45+TCRβ+ T cells (top) and P2 tetramer–specific CD4 T cells (bottom). Numbers shown indicate percentage of cells in gate. Right set of panels: Calculated total numbers of the indicated cells per retina. Each dot represents an individual mouse, and the horizontal lines show mean. The dashed line represents the limit of detection, calculated as in Figure 2. Data are representative of at least 3 independent experiments. (E) Confocal imaging of retinal sections of AireGW/+ Lyn-DC–/– mice with or without uveitis showing infiltration of TCRβ+ T cells (red) in mice with disease (original magnification, ×40; scale bars: 50 μm). Data are representative of 2 independent experiments.
Figure 5
Figure 5. LYN-deficient DCs from the eye-draining lymph nodes present more IRBP and lead to increased priming of IRBP-specific T cells.
(A) Left: Representative plots showing P2-specific CD4+ T cells in the eye-draining LNs (top) or in pooled peripheral LNs (bottom) from 15- to 20-week-old mice of indicated genotypes, quantified on the right. Each dot represents an individual mouse; horizontal lines show mean; dashed line represents the limit of detection. Data are pooled from 3 independent experiments. (B and C) Fifty thousand P2-specific T cell hybridomas cocultured overnight with DCs from either eye-draining or peripheral LNs from mice of indicated genotypes were analyzed by flow cytometry for CD69 upregulation. As a positive control, 0.1 μg/ml P2 peptide was added. (B) Left: CD69 upregulation by hybridomas cocultured with 200,000 eye-draining LN DCs. Right: CD69 expression (mean fluorescence intensity [MFI]) on hybridomas cocultured with varying numbers of DCs from either eye-draining (filled symbols) or peripheral (open symbols) LNs. As a negative control, anti-MHCII blocking antibody was added to hybridomas cocultured with 200,000 WT DCs. (C) Left: Effects of MHCII blockade on CD69 upregulation by hybridomas cocultured with 100,000 draining LN DCs, quantified over a range of DC concentrations (right). (D) Left: Representative flow cytometry plots showing CD86 and CD8 expression by resident (CD11c+MHCIIint) WT and Lyn–/– cervical LN DCs. Right: CD86 expression on indicated DC populations. Each dot represents an individual mouse; horizontal lines show mean ± SD. (E) Relative cytokine mRNA expression in WT and Lyn–/– sorted resident (CD11c+MHCIIint) LN DCs, normalized to GAPDH, and shown as arbitrary units. Data are representative of at least 3 (BD) or 2 (E) independent experiments (4–6 mice per group). *P < 0.05, Mann-Whitney test (A). *P < 0.05, **P < 0.01, ***P < 0.001, 1-way ANOVA (B and C). *P < 0.05, **P < 0.01, ***P < 0.001, unpaired 2-tailed Student’s t test (D and E).

Similar articles

Cited by

References

    1. Goodnow CC. Multistep pathogenesis of autoimmune disease. Cell. 2007;130(1):25–35. doi: 10.1016/j.cell.2007.06.033. - DOI - PubMed
    1. Cho JH, Gregersen PK. Genomics and the multifactorial nature of human autoimmune disease. N Engl J Med. 2011;365(17):1612–1623. doi: 10.1056/NEJMra1100030. - DOI - PubMed
    1. Pillai S. Rethinking mechanisms of autoimmune pathogenesis. J Autoimmun. 2013;45:97–103. doi: 10.1016/j.jaut.2013.05.003. - DOI - PMC - PubMed
    1. Nagamine K, et al. Positional cloning of the APECED gene. Nat Genet. 1997;17(4):393–398. doi: 10.1038/ng1297-393. - DOI - PubMed
    1. Finnish-German APECED Consortium. An autoimmune disease, APECED, caused by mutations in a novel gene featuring two PHD-type zinc-finger domains. Nat Genet. 1997;17(4):399–403. doi: 10.1038/ng1297-399. - DOI - PubMed

Publication types

MeSH terms