. 2016 Oct 3;126(10):3772-3782.
doi: 10.1172/JCI86923. Epub 2016 Aug 29.

Cognate HLA absence in trans diminishes human NK cell education

Cognate HLA absence in trans diminishes human NK cell education

Vanessa Landtwing et al. J Clin Invest. .

Abstract

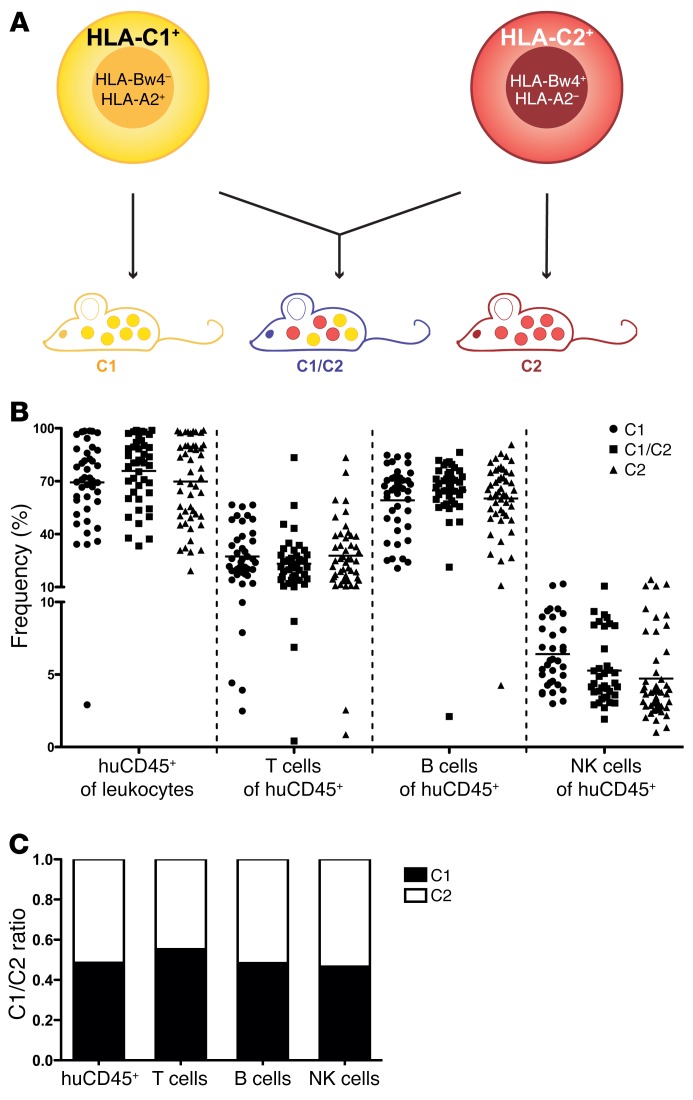
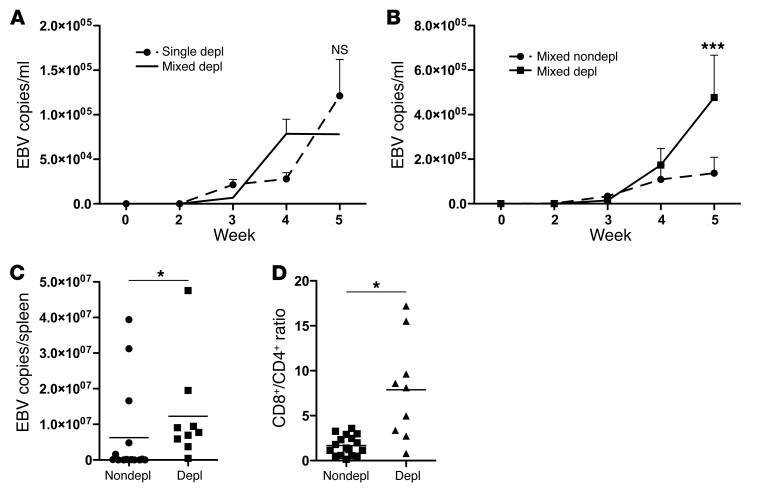
NK cells are innate lymphocytes with protective functions against viral infections and tumor formation. Human NK cells carry inhibitory killer cell Ig-like receptors (KIRs), which recognize distinct HLAs. NK cells with KIRs for self-HLA molecules acquire superior cytotoxicity against HLA- tumor cells during education for improved missing-self recognition. Here, we reconstituted mice with human hematopoietic cells from donors with homozygous KIR ligands or with a mix of hematopoietic cells from these homozygous donors, allowing assessment of the resulting KIR repertoire and NK cell education. We found that co-reconstitution with 2 KIR ligand-mismatched compartments did not alter the frequency of KIR-expressing NK cells. However, NK cell education was diminished in mice reconstituted with parallel HLA compartments due to a lack of cognate HLA molecules on leukocytes for the corresponding KIRs. This change in NK cell education in mixed human donor-reconstituted mice improved NK cell-mediated immune control of EBV infection, indicating that mixed hematopoietic cell populations could be exploited to improve NK cell reactivity against leukotropic pathogens. Taken together, these findings indicate that leukocytes lacking cognate HLA ligands can disarm KIR+ NK cells in a manner that may decrease HLA- tumor cell recognition but allows for improved NK cell-mediated immune control of a human γ-herpesvirus.


Figures

Figure 1
Figure 1. Mixed reconstitution of human immune system compartments from HLA-mismatched HPCs in NSG mice.
(A) Representative experimental overview. Three types of experimental groups were used: two groups reconstituted homozygously for HLA-C and -B allotypes (HLA-C1, -C2, and -Bw4), while disparate for HLA-A2, and the third group with a mix of both. (B) Reconstitution of human immune cell compartments in the 3 experimental groups as a percentage of human CD45+ lymphocytes. (C) Ratio of HLA-C1 donor versus HLA-C2 donor frequencies as distinguished by HLA-A2 expression in immune cell compartments of mixed reconstituted huNSG mice. Data were pooled from at least 4 independent experiments. n = 34–49. Bars represent the mean in the respective graphs.
Figure 2
Figure 2. HLA haplotype in trans does not influence the KIR repertoire in steady state.
HuNSG mice were single reconstituted with donors homozygous for HLA-C and -B allotypes (HLA-C1, -C2 , and -Bw4) (single) or reconstituted with 2 donors disparate for allotype and HLA-A2 expression (mixed). Gray pie charts depict the frequencies of KIR+ and KIR NK cells, and colored pie charts represent the indicated KIR+ NK cell subsets. (AF) Representation of KIR-expressing NK cell subsets as a percentages of total KIR+ NK cells in liver of huNSG mice (AD) or of HFL donors (E and F). KIR subsets of liver NK cells from huNSG mice reconstituted with single donors homozygous for HLA-C1 (A) or -C2 (B). (C and D) KIR subsets of liver NK cells from mixed reconstituted huNSG mice, with NK cells derived from HLA-C1 (C) and HLA-C2 (D) donors. (E and F) KIR subsets of NK cells from HLA-C1 (E) or -C2 (F) HFLs. n = 3. (G and H) Mean percentage per experiment of single KIR+ liver NK cells as derived from total NK cells of huNSG mice. Frequencies of KIR+ NK cells in single reconstituted huNSG mice as compared with those in HFL donors (G) and mixed reconstituted huNSG mice (H). Data were pooled data from at least 3 independent experiments. n = 11–14 mice per group. (G and H) Dots represent the mean of the cell population in separate experiments (paired 2-tailed Student’s t test).
Figure 3
Figure 3. Infection with EBV does not lead to skewing of KIR repertoire.
HuNSG mice were single reconstituted with donors homozygous for HLA-C and -B allotypes (HLA-C1, -C2, and -Bw4) or reconstituted with 2 donors disparate for allotype and HLA-A2 expression (mixed). Gray pie charts depict the frequencies of KIR+ and KIR NK cells, and colored pie charts represent the indicated KIR+ NK cell subsets. (AD) Subsets of KIR-expressing NK cells as a percentages of total KIR+ NK cells in spleens of EBV-infected huNSG mice. (EP) Frequency of single KIR+ NK cells in spleens of huNSG mice at endpoint. Comparison of PBS controls with EBV-infected animals for frequency of KIR2DL1+, KIR2DL2/3+, or KIR3DL1+ NK cells in homozygous reconstituted mice with HLA-C1 donor (EG), mixed reconstituted mice with cells derived from HLA-C1 (HJ) or -C2 (KM) donors, and homozygous reconstituted mice with cells from HLA-C2 donors (MP). Data are pooled from at least 3 independent experiments. n = 8–15 mice per group. Bars represent the mean (unpaired Student’s t test).
Figure 4
Figure 4. Loss of NK cell education in the presence of noncognate MHC class I in mixed reconstituted huNSG mice.
huNSG mice were single reconstituted with donors homozygous for HLA-C and -B allotypes (HLA-C1, -C2, and -Bw4) (Single) or reconstituted with 2 donors disparate for allotype and HLA-A2 expression (Mixed). Δ%CD107a refers to the difference in degranulation with and without K562 restimulation. The average ± SEM of spontaneous degranulation was 4.04% ± 0.79%. (AC) Degranulation of single KIR+ NK cells after incubation of K562 cells with splenocytes from huNSG mice reconstituted with (A) homozygous HLA-C2 or mixed donors (n = 12–18 mice/group), (B) homozygous HLA-C1 or mixed donors (n = 11–14 mice/group), or (C) homozygous HLA-Bw4 or mixed donors (n = 15–20 mice/group), infected (red lines) or not (black lines) with EBV for 5 weeks. According to single reconstituted allotypes, eduKIR denotes educated NK cells and non-eduKIR denotes noneducated NK cells gated on cells derived from donors used for single reconstitution in both single and mixed reconstituted huNSG mice, respectively. (D) Degranulation of KIRNKG2A (non-edu) and KIRNKG2A+ (edu) NK cells after incubation of K562 cells with splenocytes from single or double (Mixed) reconstituted huNSG mice (n = 7–10/group), gated on cells derived from donors used for single reconstitution. Data in AC were pooled from at least 3 independent experiments, data in D are compound data from 2 independent experiments. **P < 0.01 and ***P < 0.001, by multiple paired Student’s t tests.
Figure 5
Figure 5. Inhibition by cognate MHC class I ligands is maintained in noneducated NK cells.
huNSG mice were single reconstituted with donors homozygous for HLA-C and -B allotypes (HLA-C1, -C2, and -Bw4) (Single) or reconstituted with 2 donors disparate for allotype and HLA-A2 expression (Mixed) and incubated with MHC class I–negative target cells (K562) or K562 transfectants expressing HLA-C1, -C2, or -Bw4 MHC class I ligands. Δ%CD107a refers to the difference in degranulation with and without K562 restimulation. Average ± SEM of spontaneous degranulation was 3.55% ± 0.73%. (AC) Degranulation of single KIR2DL1+ NK cells after incubation of K562 or K562-C2 cells with splenocytes from huNSG mice reconstituted with HLA-C2 homozygous or mixed donors (A) and paired analysis for incubation with K562 cells (B) or K562-C2 transfectants (C). (DF) Degranulation of single KIR2DL2/3+ NK cells after incubation of K562 or K562-C1 cells with splenocytes from huNSG mice reconstituted with HLA-C1 homozygous or mixed donors (D) and paired analysis for incubation with K562 cells (E) or K562-C1 transfectants (F). (GI) Degranulation of single KIR3DL1+ NK cells after incubation of K562 or K562-Bw4 cells with splenocytes from huNSG mice reconstituted with HLA-Bw4 homozygous or mixed donors (G) and paired analysis for incubation with K562 cells (H) or K562-Bw4 transfectants (I). Data were pooled from at least 2 independent experiments. Bars represent the mean on relevant graphs. n = 7–14 mice per group. *P < 0.05, **P < 0.01, and ***P < 0.001, by multiple paired Student’s t tests.
Figure 6
Figure 6. Improved EBV-specific immune control in mixed reconstituted huNSG mice.
Viral loads in spleens of huNSG mice were read out over time in blood and at the endpoint (week 4 or 5). Homozygous single reconstituted huNSG mice (Single) were compared with mixed reconstituted mice (Mixed). (A and B) Viral loads in blood at weekly time points (A) and in spleen (B) of single versus mixed reconstituted huNSG mice for a representative experiment (n = 3–9 mice/group for A. Data represent the mean ± SEM, *P < 0.05 by ANOVA with Bonferroni’s correction. (C and D) Fold difference in viral load for blood (C) and spleen (D) at the endpoint normalized to the mean of mixed reconstituted group. (E) CD8+/CD4+ T cell ratio in blood at endpoints in single versus mixed reconstituted huNSG mice. Data in CE were pooled from at least 3 independent experiments. n = 15–40. Bars represent the mean. *P < 0.05, by Mann-Whitney U or unpaired Student’s t test where appropriate.
Figure 7
Figure 7. NK cells mediate protection in mixed reconstituted huNSG mice.
Viral loads of huNSG mice were read out over time in blood and at the endpoint (week 4 or 5) in spleens. Homozygous single reconstituted huNSG were compared with mixed reconstituted animals, and non–NK cell–depleted (Nondepl) were compared with NK cell–depleted (Depl) mixed reconstituted huNSG mice. (A) Representative experiment for viral loads in blood at weekly time points in NK cell–depleted single versus NK cell–depleted mixed reconstituted huNSG mice (n = 3–8 mice/group). (B) Viral loads in blood over time in nondepleted (Nondepl) versus NK cell–depleted mixed reconstituted huNSG mice. (C) Endpoint viral loads in spleen for nondepleted versus NK cell–depleted (Depl) mixed reconstituted huNSG mice. (D) CD8+/CD4+ T cell ratio in blood at the endpoint in nondepleted versus NK cell–depleted mixed huNSG mice. Data in BD were pooled from at least 2 independent experiments. n = 8–15 mice per group. Data represent the mean ± SEM or bars represent the mean. *P < 0.05 and ***P < 0.001, by ANOVA with Bonferroni’s correction, Mann-Whitney U test, or unpaired Student’s t test where appropriate.

Similar articles

Cited by

References

    1. Herberman RB, Nunn ME, Lavrin DH. Natural cytotoxic reactivity of mouse lymphoid cells against syngeneic acid allogeneic tumors. I. Distribution of reactivity and specificity. Int J Cancer. 1975;16(2):216–229. doi: 10.1002/ijc.2910160204. - DOI - PubMed
    1. Trinchieri G, Santoli D. Anti-viral activity induced by culturing lymphocytes with tumor-derived or virus-transformed cells. Enhancement of human natural killer cell activity by interferon and antagonistic inhibition of susceptibility of target cells to lysis. J Exp Med. 1978;147(5):1314–1333. doi: 10.1084/jem.147.5.1314. - DOI - PMC - PubMed
    1. Kiessling R, Klein E, Wigzell H. “Natural” killer cells in the mouse. I. Cytotoxic cells with specificity for mouse Moloney leukemia cells. Specificity and distribution according to genotype. Eur J Immunol. 1975;5(2):112–117. doi: 10.1002/eji.1830050208. - DOI - PubMed
    1. Long EO, Kim HS, Liu D, Peterson ME, Rajagopalan S. Controlling natural killer cell responses: integration of signals for activation and inhibition. Annu Rev Immunol. 2013;31:227–258. doi: 10.1146/annurev-immunol-020711-075005. - DOI - PMC - PubMed
    1. Martinet L, Smyth MJ. Balancing natural killer cell activation through paired receptors. Nat Rev Immunol. 2015;15(4):243–254. doi: 10.1038/nri3799. - DOI - PubMed

Publication types

Substances