. 2016 Oct 3;126(10):3739-3757.
doi: 10.1172/JCI81568. Epub 2016 Aug 29.

RB1 deficiency in triple-negative breast cancer induces mitochondrial protein translation

RB1 deficiency in triple-negative breast cancer induces mitochondrial protein translation

Robert A Jones et al. J Clin Invest. .

Abstract

Triple-negative breast cancer (TNBC) includes basal-like and claudin-low subtypes for which no specific treatment is currently available. Although the retinoblastoma tumor-suppressor gene (RB1) is frequently lost together with TP53 in TNBC, it is not directly targetable. There is thus great interest in identifying vulnerabilities downstream of RB1 that can be therapeutically exploited. Here, we determined that combined inactivation of murine Rb and p53 in diverse mammary epithelial cells induced claudin-low-like TNBC with Met, Birc2/3-Mmp13-Yap1, and Pvt1-Myc amplifications. Gene set enrichment analysis revealed that Rb/p53-deficient tumors showed elevated expression of the mitochondrial protein translation (MPT) gene pathway relative to tumors harboring p53 deletion alone. Accordingly, bioinformatic, functional, and biochemical analyses showed that RB1-E2F complexes bind to MPT gene promoters to regulate transcription and control MPT. Additionally, a screen of US Food and Drug Administration-approved (FDA-approved) drugs identified the MPT antagonist tigecycline (TIG) as a potent inhibitor of Rb/p53-deficient tumor cell proliferation. TIG preferentially suppressed RB1-deficient TNBC cell proliferation, targeted both the bulk and cancer stem cell fraction, and strongly attenuated xenograft growth. It also cooperated with sulfasalazine, an FDA-approved inhibitor of cystine xCT antiporter, in culture and xenograft assays. Our results suggest that RB1 deficiency promotes cancer cell proliferation in part by enhancing mitochondrial function and identify TIG as a clinically approved drug for RB1-deficient TNBC.


Figures
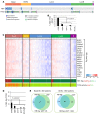
Figure 1
Figure 1. RB1 and TP53 are frequently lost together in TNBC.
(A) Oncoprint plot of RB1 and TP53 alterations in the Breast Invasive Carcinoma, TCGA data set (n = 463 complete samples with mutation, copy number, and expression data). The overlap coefficient of combined RB1 and TP53 loss was 0.94 (P = 0.121) in basal BC and 0.78 (P = 4.34 × 10⁻⁹) in all BC subtypes. (B) Percentage of tumors from major molecular subtypes with alterations in both RB1 and TP53. Patients with basal BC showed frequent alterations in both RB1 and TP53 relative to other subtypes (40%; P = 0.00151, by Kruskal-Wallis test). (C) Patients with RB1 loss of function identified using an 18-gene RB1 loss Sig. (D) A significantly higher percentage of basal tumors was RB Sig+ p53lo (~28%, P = 0.000372, by Kruskal-Wallis test) compared with all other subtypes. (E) Venn diagrams showing overlaps between RB Sig+ and TP53lo in basal BC and all BC samples. Significant overlaps between RB Sig+ and TP53lo were observed in both groups: basal BC = 0.77 (P = 5.69 × 10⁻⁴); all BC = 0.56 (P = 2.53 × 10⁻³²). LumA, luminal A; LumB, luminal B; N, normal-like.
Figure 2
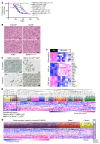
Figure 2. Disruption of Rb and p53 through diverse Cre drivers induces spindle-cell tumors that cluster with human claudin-low BC.
(A) Kaplan-Meier mammary tumor-free survival curves of the indicated mouse or transplantation models used to disrupt Rb and p53. P values were determined by log-rank test. (B) Histology of mammary tumors from MMTV-Cre Rbfl/fl p53fl/fl transplanted cells (T-MCRP), MMTV-Cre Rbfl/fl mice (MCRP), Ad-Cre Rbfl/fl p53fl/fl transplanted cells (ACRP), or MMTV-Cre Rbfl/fl p53LSLR270H/+ mice showing very similar spindle-cell morphology with numerous mitotic cells. (C) Immunostaining for vimentin (mesenchymal marker) and E-cadherin (luminal marker) of an adenocarcinoma (left) and spindle-cell carcinoma (right) isolated from the indicated mice. Note the widespread expression of E-cadherin in Rb-deficient adenocarcinoma, but only in normal epithelial ducts in Rb/p53-deficient spindle tumors. (D) Cluster analysis comparing RbΔp53Δ tumors (indicated by an asterisk) with 13 different BC mouse models showing resemblance to other models of spindle-like tumors. MMTV-Cre BrcaCo/Co p53+/–, Brca floxed, p53 heterozygous. (E) Cluster analysis of RbΔp53Δ tumors with human BC using a human claudin-low predictor. Blue (low expression); magenta (high expression). Asterisk indicates the location of the Rb/p53 mouse samples. (F) Heatmap of EMT and claudin-low–related markers in Rb/p53-deficient spindle-cell mammary tumors relative to normal mammary glands. Scale bars: 50 μm (B and C). up, upregulation; down, downregulation.
Figure 3
Figure 3. Rb/p53-deficient mammary tumors show a high frequency of CD49f+CD24 TICs and genomic amplifications involving Met, Birc2/3-Mmp13-Yap1, and Pvt1-Myc.
(A) Flow cytometric profiles of normal mammary gland and p53Δ and RbΔp53Δ claudin-low mammary tumors with CD49f and CD24 cell-surface markers. (B) Gates used to isolate tumor cell populations (1°). FACS profiles of secondary tumors obtained from CD49floCD24lo (P1), CD49fhiCD24lo (P2), and CD49fhiCD24hi (P3) populations (2°). See Table 1 for TIC frequency. (C) Probe level images of copy number data showing high-level amplifications on chromosomes (Chrom) 6qA2, 9qA1, and 15qD1. (D) Integration of CNAs with gene expression identified genes regulated at the genomic and transcriptional levels, including Met, Pvt1, and Mmp13 amplification as well as Fhit deletion on chromosome 14qA1. Green (low); red (high). CN, copy number; mam, mammary; PE, phycoerythrin.
Figure 4
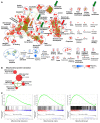
Figure 4. Pathway analysis of Rb/p53- versus p53-deficient tumors reveals induction of the MPT pathway.
(A) GSEA of RbΔp53Δ (red) versus p53Δ (blue) claudin-low (CL) mammary tumors. Orange and red arrows point to cell-cycle and EMT/fetal development/WNT pathways, respectively; green arrows point to metabolic pathways including MPT elevated in Rb/p53 tumors. NES, normalized enrichment score; TF, transcription factor. (B) Specific MPT pathways induced in Rb/p53- versus p53-deficient tumors. (C) Enrichment plots for the indicated MPT pathways.
Figure 5
Figure 5. E2F1 consensus–binding sites and recruitment to MPT promoters in BC.
(A) Mouse oPOSSUM analysis showing E2F consensus–binding sites in cell-cycle and MPT, but not nucleotide metabolism, pathways within –1 kb to +2 kb around the TSS. Significant binding sites are on the top right (arrows point to E2F). (B and C) Human ENCODE ChIP-seq of MCF7 cells and ChIP-microarray (ChIP-chip) of MCF7 (B) and MCF10A (C) showing 19 MPT genes with E2F consensus sites that scored positive for E2F1 binding. Known E2F1-regulated cell-cycle genes are shown as positive controls.
Figure 6
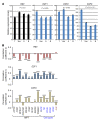
Figure 6. Expression of RB1 and activating E2Fs in BC subtypes in correlation with MPT and cell-cycle genes.
(A) Relative expression levels of RB1, E2F1, E2F2, and E2F3 in 1,500 samples of TNBC (T), HER2 (Her), luminal A (A), and luminal B (B) BCs. (B) Correlation analysis of RB1, E2F1, and E2F3 expression levels with those of the indicated MPT versus known E2F-regulated cell-cycle or albumin genes in 2,228 mixed BC subtypes. *P < 0.05, **P < 0.005, and ***P < 0.0005, for the correlation (Pearson’s r) by a 2-tailed t test with n-2 degrees of freedom.
Figure 7
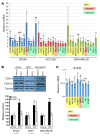
Figure 7. E2F1 and RB1 control MPT gene expression in BC cells.
(A) Relative fold change in gene expression of MPT, apoptotic, and cell-cycle genes 3 days after Ad-E2F1 and Ad-BCL2 infection compared with control Ad-GFP and Ad-BCL2 in the indicated TNBC cell lines. Values were normalized to GAPDH and calibrated to the GFP control (n = 3). *P < 0.05, **P < 0.005, and ***P < 0.0005, by 2-tailed t test. (B) Western blot and quantification of mitochondrially (COX II) and cytosolically (COX IV) translated proteins normalized to tubulin in luminal (MCF7) and TNBC cell lines (BT549 and MDA-MB-231) 3 days after Ad-E2F1 transduction compared with Ad-GFP (vehicle). *P < 0.05 and **P < 0.01, by 2-tailed t test. (C) Relative fold change in gene expression of MPT, apoptotic, and cell-cycle genes 2 days after Ad-RB1 transduction compared with control Ad-GFP in RB1-deficient TNBC cells (BT549). n = 3, each performed in triplicate. §P = 0.0652, *P < 0.05, **P < 0.005, and ***P < 0.0005, by 2-tailed t test.
Figure 8
Figure 8. FDA-approved drug screens of Rb/p53-deficient tumors identify TIG, an MPT inhibitor.
(A) Western blot analysis of pRb and p53 in 3 primary mammary tumor cell lines (lines 1 and 2 RbΔp53Δ; line 3 RbΔp53C139R/+). 293T human cells served as a positive control; tubulin was used as a loading control. (B) Heatmap showing expression levels of Rb, p53, and genes associated with the claudin-low subtype in the 3 mouse Rb/p53 lines. (C) Scatter plot depicting the inhibitory effects of 312 FDA-approved drugs at a dose of 10 μM in RbΔp53Δ and RbΔp53mut/+ lines and schematic of the molecular structure of TIG. (D) TIG dose-response curves for 3 RB1-null and 3 RB1-proficient human claudin-low TNBC cell lines by MTT assay. P < 0.0001, by nonlinear regression analysis using GraphPad Prism 6.0. n = 3 assays, each performed in sextuplicate. (E) TIG dose-response curves for 2 RB1-null and 3 RB1-proficient human basal-like TNBC cell lines. P < 0.0001, by nonlinear regression analysis using GraphPad Prism 6.0. n = 3, each performed in sextuplicate. (F) Western blot for COX I and COX II (mitochondrially translated) and COX IV (cytosolically translated) proteins following TIG treatment. Relative protein levels were normalized to the tubulin loading control. (G) Luciferase assay measuring ATP content in TNBC lines after treatment with 2 μM TIG. n = 3, performed with 4 to 10 replicates per experiment. *P < 0.05, by 2-tailed t test. (H) MTT growth assay following combined TIG plus doxorubicin (Dox) on MDA-MB-231 cells. n = 2, each performed in triplicate. ctrl, control.
Figure 9
Figure 9. Effects of TIG and SSZ on RB1/TP53-deficient TNBC cell lines.
(A) MTT assays on RB1-proficient and RB1-deficient TNBC lines treated with the indicated concentrations of TIG; SSZ was used at a dose of 500 μM for Hs578t and 300 μM for MDA-MB-436, MDA-MB-231, and BT549 cells. n = 3–5, each performed in triplicate. (B) ROS in TNBC cells 72 hours after treatment with IC50 for each line. n = 3; 10,000 events each. **P < 0.01 and #P = ~0.1 , by 2-tailed t test. (C) Representative apoptosis assays by annexin V flow cytometry depicting the live-cell fraction 72 hours after treatment with IC50 drug concentrations. n = 3; 10,000 events each. (D) CD24ESA+CD44+ CSC fractions in TNBC lines 72, 120, and 168 hours after treatment using IC50.
Figure 10
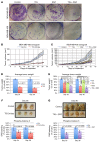
Figure 10. Potent suppression of RB1/TP53-deficient TNBC xenograft growth by TIG with or without SSZ.
(A) Colony-forming assay for RB1+ MDA-MB-231 and RB1 MDA-MB-436 cells after 14 days of continuous treatment with IC40 for each line. (B) Tumor volume of MDA-MB-436 xenografts in NSG mice treated with TIG twice daily (n = 9/group). (C) Tumor volume of MDA-MB-436 xenografts treated daily with TIG and/or SSZ (n = 8/group). (D and E) Average tumor weight following 22 to 24 or 36 days of treatment (endpoint). n = 3–6 per group. (F and G) Quantification of phospho-histone 3 staining (n = 3). P values were determined by 2-tailed t test.
Figure 11
Figure 11. RB1 loss/induction of E2F1 promotes proliferation of TNBC cells by transcriptionally inducing both cell-cycle and MPT genes.
Loss of pRb and therefore deregulation of activating E2Fs induce not only cell-cycle genes but also MPT genes, leading to increased MPT. Inhibition of MPT by TIG effectively suppresses cell proliferation and tumor progression in RB1-deficient TNBC.

Similar articles

Cited by

References

    1. Prat A, Perou CM. Deconstructing the molecular portraits of breast cancer. Mol Oncol. 2011;5(1):5–23. - PMC - PubMed
    1. Curtis C, et al. The genomic and transcriptomic architecture of 2,000 breast tumours reveals novel subgroups. Nature. 2012;486(7403):346–352. - PMC - PubMed
    1. Cancer Genome Atlas Network Comprehensive molecular portraits of human breast tumours. Nature. 2012;490(7418):61–70. doi: 10.1038/nature11412. - DOI - PMC - PubMed
    1. Nik-Zainal S, et al. Landscape of somatic mutations in 560 breast cancer whole-genome sequences. Nature. 2016;534(7605):47–54. - PMC - PubMed
    1. Jiang Z, et al. Rb deletion in mouse mammary progenitors induces luminal-B or basal-like/EMT tumor subtypes depending on p53 status. J Clin Invest. 2010;120(9):3296–3309. doi: 10.1172/JCI41490. - DOI - PMC - PubMed

Publication types

MeSH terms