. 2017 Feb 1;19(2):219-228.
doi: 10.1093/neuonc/now160.

Multi-omics analysis of primary glioblastoma cell lines shows recapitulation of pivotal molecular features of parental tumors

Affiliations

Multi-omics analysis of primary glioblastoma cell lines shows recapitulation of pivotal molecular features of parental tumors

Shai Rosenberg et al. Neuro Oncol. .

Abstract

Background: Glioblastoma (GBM) is the deadliest primary brain cancer in adults. Emerging innovative therapies hold promise for personalized cancer treatment. Improving therapeutic options depends on research relying on relevant preclinical models. In this line we have established in the setting of the GlioTex project (GBM and Experimental Therapeutics) a GBM patient-derived cell line (GBM-PDCL) library. A multi-omic approach was used to determine the molecular landscape of PDCL and the extent to which they represent GBM tumors.

Methods: Single nucleotide polymorphism array, expression arrays, exome sequencing, and RNA sequencing were used to measure and compare the molecular landscapes of 20 samples representing 10 human GBM tumors and paired GBM-PDCLs.

Results: Copy number variations were similar for a median of 85% of the genome and for 59% of the major focal events. Somatic point mutations were similar in a median of 41%. Mutations in GBM driver and "druggable" genes were maintained in 67% of events. Mutations that were not conserved in the PDCL were mainly low allelic fraction and/or non-driver mutations. Based on RNA expression profiling, PDCLs cluster closely to their parental tumor with overexpression of pathways associated with cancer progression in PDCL.

Conclusions: Overall, PDCLs recapitulate pivotal molecular alterations of paired-parental tumors supporting their use as a preclinical model of GBM. However, some driver aberrations are lost or gained in the passage from tumor to PDCL. Our results support using PDCL as a relevant preclinical model of GBM. Further investigations of changes between PDCLs and their parental tumor may provide insights into GBM biology.

Keywords: cancer; cell lines; genome; glioblastoma.


Figures

Fig. 1
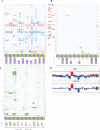
Fig. 1
Copy number variation landscape. (A). Tumor and PDCL heatmap. Tumors (T) and their paired PDCL (C) are adjacent to each other. Red denotes gain and blue denotes loss in relation to estimated ploidy. Darker color stands for higher gain or deeper deletion. The bar chart at the bottom gives the level of agreement for each tumor–PDCL pair. (B) Heatmap filtered for high-level amplification (CN≥ploidy+3) is denoted in red, and deeper deletions (CN=0 or CN≤1 if ploidy is 4) are colored blue. The bar chart at the bottom gives the level of agreement for each tumor–PDCL pair. (C) Heatmap describing estimated CN-LOH. The bar chart at the bottom gives the level of agreement for each tumor–PDCL pair with purple for general LOH and light green for CN-LOH. (D). Genomic landscape of the group of PDCLs (top) and group of tumors (bottom).
Fig. 2
Fig. 2
Point mutations landscape. (A) Point mutations for GBM driver genes (top) and druggable genes (bottom, below the red line). Tumors and their paired PDCL are adjacent to each other. Different colors are given for the mutation types. For the left 7 pairs, germ line information was used for somatic mutations inference. For the right 3 pairs, germ line information was unavailable and mutations defined as “novel” are shown (see “Methods” section). (B) Frequency of mutations that appeared in both tumor and PDCL (yellow), tumor only (blue), PDCL only (red). (C) Mutation characteristics for the combined set of somatic mutations. In each histogram, the distribution of allelic fraction (x-axis) of mutations is given. The y-axis denotes mutation count. Each histogram bar is divided for the tissues in which the mutations were detected: (i) both tumor and PDCLs, (ii) PDCL only, and (iii) tumor only. The 6 histograms are ordered in columns and rows. The columns define gene set groups: (i) all genes, (ii) COSMIC genes, (iii) GBM driver genes. The rows define the predicted functional impact class (“impact,” “no impact”). (D) TP53 staining for parental tumors 4724T and 3719T.
Fig. 3
Fig. 3
Transcriptome (array data) landscape. (A). MDS for all measured genes. Each sample is denoted by a different color, tumors are marked as triangles and PDCLs as circles. (B) MDS for all genes excluding 2643 differentially expressed genes between the tumor and PDCL groups. (C) Ingenuity pathway analysis for the 2643 differentially expressed genes. Only biological pathways that are both significant and for which the activation/inhibition direction could be inferred are shown. Orange denotes pathway activation in PDCL compared with parental tumors and blue denoted pathway inhibition.

Similar articles

Cited by

References

    1. Prados MD, Byron SA, Tran NL, et al. Toward precision medicine in glioblastoma: the promise and the challenges. Neuro Oncol. 2015;17(8):1051–1063. - PMC - PubMed
    1. Kwak EL, Bang Y-J, Camidge DR, et al. Anaplastic lymphoma kinase inhibition in non-small-cell lung cancer. N Engl J Med. 2010;363(18):1693–1703. - PMC - PubMed
    1. Ciardiello F, Tortora G. EGFR antagonists in cancer treatment. N Engl J Med. 2008;358(11):1160–1174. - PubMed
    1. Ciriello G, Miller ML, Aksoy BA, et al. Emerging landscape of oncogenic signatures across human cancers. Nat Genet. 2013;45(10):1127–1133. - PMC - PubMed
    1. Lazar V, Rubin E, Depil S, et al. A simplified interventional mapping system (SIMS) for the selection of combinations of targeted treatments in non-small cell lung cancer. Oncotarget. 2015;6(16):14139–14152. - PMC - PubMed

MeSH terms