. 2016 Feb 1:1:15030.
doi: 10.1038/nmicrobiol.2015.30.

The metabolic background is a global player in Saccharomyces gene expression epistasis

Affiliations

The metabolic background is a global player in Saccharomyces gene expression epistasis

Mohammad Tauqeer Alam et al. Nat Microbiol. .

Abstract

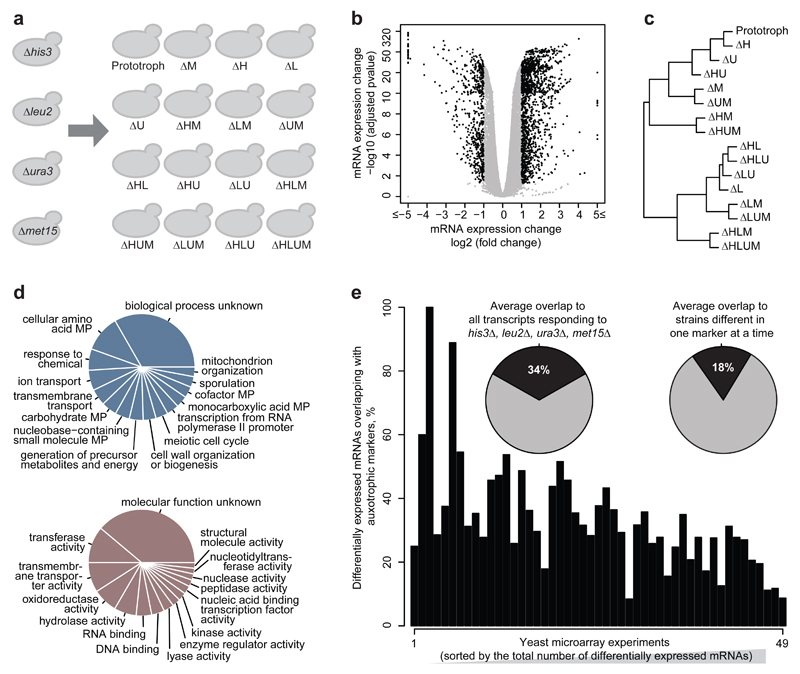
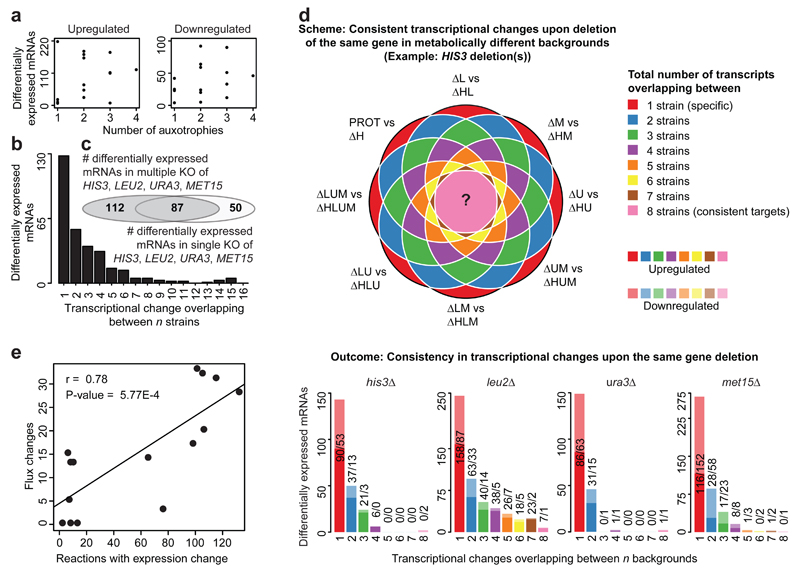
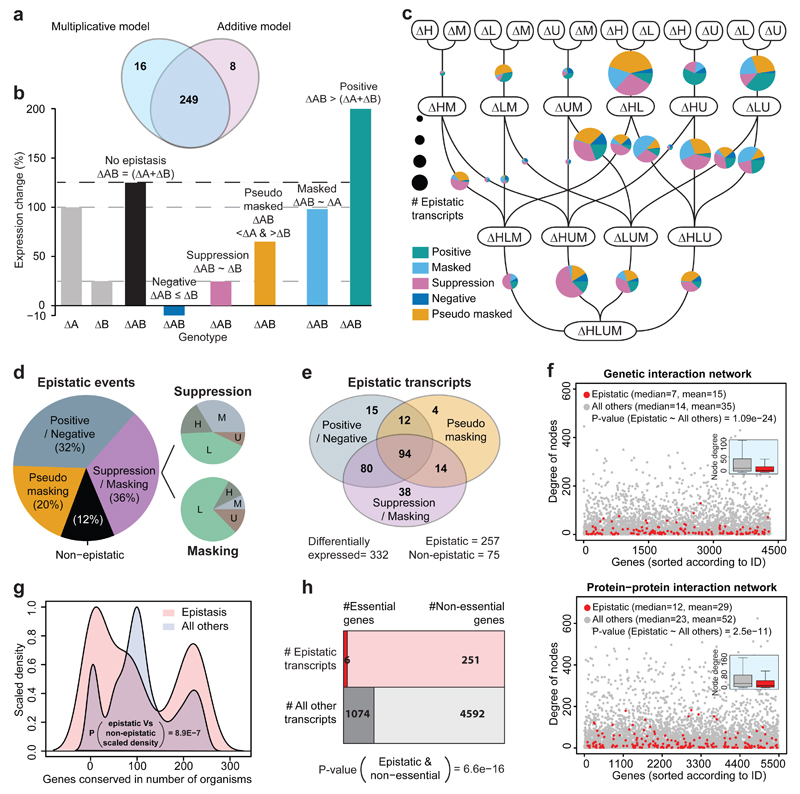
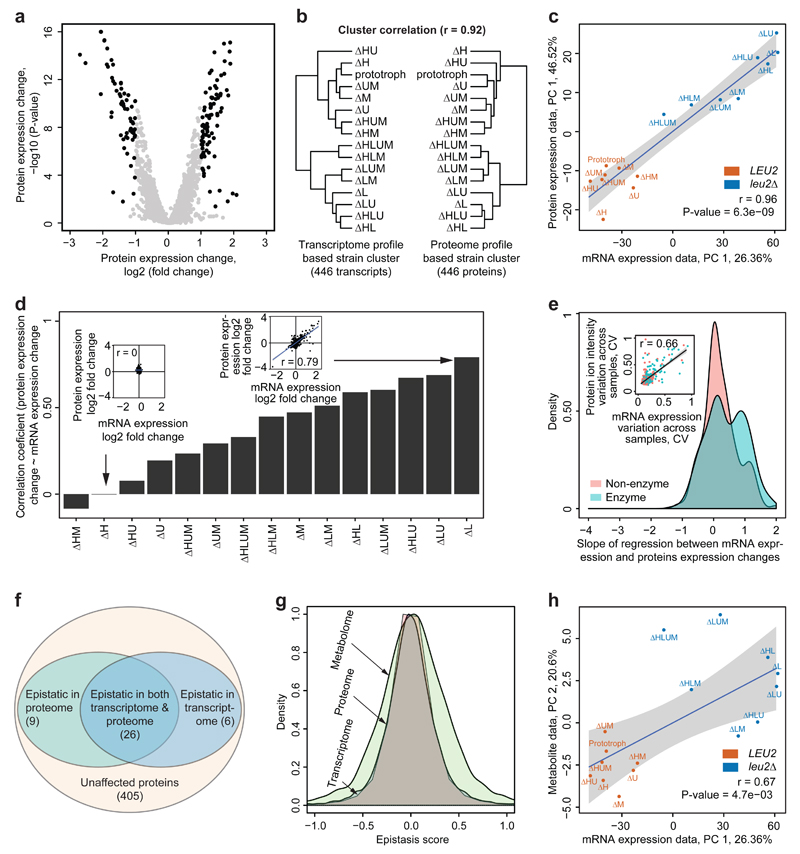
The regulation of gene expression in response to nutrient availability is fundamental to the genotype-phenotype relationship. The metabolic-genetic make-up of the cell, as reflected in auxotrophy, is hence likely to be a determinant of gene expression. Here, we address the importance of the metabolic-genetic background by monitoring transcriptome, proteome and metabolome in a repertoire of 16 Saccharomyces cerevisiae laboratory backgrounds, combinatorially perturbed in histidine, leucine, methionine and uracil biosynthesis. The metabolic background affected up to 85% of the coding genome. Suggesting widespread confounding, these transcriptional changes show, on average, 83% overlap between unrelated auxotrophs and 35% with previously published transcriptomes generated for non-metabolic gene knockouts. Background-dependent gene expression correlated with metabolic flux and acted, predominantly through masking or suppression, on 88% of transcriptional interactions epistatically. As a consequence, the deletion of the same metabolic gene in a different background could provoke an entirely different transcriptional response. Propagating to the proteome and scaling up at the metabolome, metabolic background dependencies reveal the prevalence of metabolism-dependent epistasis at all regulatory levels. Urging a fundamental change of the prevailing laboratory practice of using auxotrophs and nutrient supplemented media, these results reveal epistatic intertwining of metabolism with gene expression on the genomic scale.


Conflict of interest statement

The authors declare no competitive interests.

Figures

Fig. 1
Fig. 1. The gene expression response to 16 combinatorial differences in the metabolic-genetic background
(a) Schematic overview of otherwise isogenic 16 S. cerevisiae strains possessing nutrient-complemented auxotrophies in histidine (his3Δ), leucine (leu2Δ), uracil (ura3Δ) and methionine (met15Δ) metabolism (b) Differential gene expression with reference to the prototrophic yeast (Volcano plot) illustrating gene expression (log2 scaling) and significance (-log10 scaling, BH adj. P-value) for the 16 metabotypes grown in synthetic complete medium, as determined by RNA sequencing (n = 3/strain). (c) Hierarchical clustering of mRNA expression profiles by means of euclidean distance and complete linkage agglomeration, dividing the 16 strains first by leucine, followed by methionine auxotrophy (d) Top 15 enriched Gene Ontology (GO):Process slim mapper (top) and GO:Function slim terms (bottom), across 573 differentially expressed transcripts changed > 2 fold change, adj. P-value <0.05 with reference to the prototrophic strain. MP = metabolic process. (e) Confounding effects of metabotype on transcriptome. Overlap between genes highly and significantly (fold change >2, adj. P-value <0.05) differentially expressed in the auxotrophic strains, to those detected differentially expressed across previously published microarray experiments conducted upon single gene-deletion in the BY4741 auxotrophic background. Expression profiles have been sorted according to No of differentially expressed transcripts (ascending). Insets: Average overlaps between transcriptome obtained for all four markers, or those differing in just one marker at a time.
Fig. 2
Fig. 2. The transcriptional response to a metabolic gene deletion is sensitive to the metabolic-genetic background
(a) The number of auxotrophies is no predictor for total differential gene expression quantities. Numbers are given in relation to the prototrophic strain; the analysis relative to the expression median is given in Supplementary Fig. S3c. (b) Specific transcriptional profiles dominate over commonly regulated genes; the majority of transcripts responds specifically in one or two of the 16 strains, despite these differ in just four metabolic genes to each other. (c) Overlap of gene expression changes (adj. P-value <0.05, fold change 2) induced when HIS3, LEU2, URA3 or MET15 were deleted separately or in combination (adj. P-value <0.05, fold change >2 Please see Supplementary Fig. S3g without fold-change cut-off) (d) Transcriptional response upon deleting the same gene (illustration example for HIS3) in a different metabotype reveals the dominance of context-specific transcriptional responses; Genes that consistently respond to the same deletion (in up to eight cases) are the exception. Lighter colors indicate down-regulated genes, whereas opaque colors represent up-regulated mRNAs. (adj. P-value <0.05, fold change > 2. Please see Supplementary Fig. S6c for the same analysis without fold-change cut-off) (e) Flux variability analysis predicts context-dependent flux changes that correlate with strain-specific gene expression. Significant correlation (r = 0.78, P-value = 5.77E-4) between the number of reactions in which at least one gene is differentially expressed, and the number of reaction for which the flux-range is significantly different.
Fig. 3
Fig. 3. Metabolic perturbations interact epistatically and dominate quantitative expression profiles
(a) Multiplicative and additive models identify to 97% the same transcripts as being affected by metabolism-induced epistasis, when considering transcripts differentially expressed (>2 fold change; adj. P-value <0.05) compared to the median expression value of each gene. (b) Schematic illustration: Classification of epistatic phenotypes on the basis of a linear model. (c) The 16 strains aligned in a neighborhood network to illustrate the 38 neighborhood pairs that differ from each other in just one metabolic gene at a time. mRNA expression profiles were pairwisely compared to identify and classify epistatic gene expression changes (b). Size of the Pie charts represents the number of epistatically responding transcripts as identified in each neighborhood, and their distribution between the categories as defined in (b). (d) Classification of epistatic events. Additive events (12%), considered non-epistatic according to, contrast to epistatic interactions classified as masking and suppression, positive and negative epistasis, and pseudo-masking. Given is the sum of all events across the 38 neighborhood pairs illustrated in Fig. 3c. Suppressive interactions were found frequent for all four alleles, masking interactions are dominated by LEU2. (e) Transcripts affected by epistatic interactions switch between subcategories dependent on metabotype. Compared are transcripts differentially expressed according to median (>2 fold change; adj. P-value < 0.05) (f) Degree distribution of transcripts affected by metabolism-induced epistasis and all other transcripts in a genetic interaction network and protein-protein interaction network. Genes encoding for transcripts epistatic transcripts are significantly less connected compared to the average gene. (g) Density-distribution of PSI-BLAST identified orthologues of epistatically responding and all other genes. Those affected by metabolism-induced epistasis are significantly less conserved compared. (h) Distribution of essential genes across epistatically responding and all other transcripts, according to viability in S. cerevisiae. Genes affected by metabolism-induced epistasis are less often essential.
Fig. 4
Fig. 4. Metabolism-induced epistasis propagates to the proteome and increases at the metabolome
(a) Differential protein expression between 16 metabotypes grown in supplemented SC medium determined by HDMSE as illustrated in a volcano plot, expression values log2 in x axis, adj. P-values –log10 in y axis, n=3/strain. (b) Hierarchical clusters based on euclidean distance and complete linkage agglomeration of gene and protein expression profiles correspond to each other (r = 0.92) Transcriptome and proteome cluster the strains in a similar fashion. (c) Correlation of the major principal component of mRNA and protein expression. Strains are color coded according to presence or absence of the LEU2 gene, that has the most consistent (least epistatic) impact. (d) Pearson's correlation coefficient of mRNA and protein expression values for 446 proteins and transcripts as identified in (a). Transcriptome and proteome correlate quantitatively in strains with differential protein expression (insets). (e) Transcript and protein dynamic range correspond for metabolic enzymes. Slope of regression between gene and protein expression dynamic range, distinguishing enzymatic and non-enzymatic genes. Inset: fold-change induction across all differentially expressed genes, comparing mRNAs and protein level change. (f) A majority of genes affected by epistasis on transcriptome are epistatic the proteome as well; P-value <0.05, fold change >2, Z score > 2s or < -2s. (g) Metabolic epistasis affects transcriptome and proteome to a similar extent, but has broader impact on metabolite concentrations (represented by the absolute quantities in 50 essential metabolites (Supplementary Fig. S11)); the distribution is expressed as Epistatic score e, describing the relative deviation of an expression quantity from a linear relationship in pairwise interactions and illustrated as density plot of all quantified transcripts, proteins and metabolites. Transcriptome and proteome show the same distribution of e, which is increased on the metabolome. (h) Correlation between first principal component of transcriptome data (26.36%) and the second principal component of metabolome data (20.6%). Strains are colored according to the presence and absence of LEU2 gene, which had strongest loading.

Comment in

References

    1. Albert R. Scale-free networks in cell biology. J Cell Sci. 2005;118:4947–4957. - PubMed
    1. Barabási A-L, Oltvai ZN. Network biology: understanding the cell’s functional organization. Nat Rev Genet. 2004;5:101–113. - PubMed
    1. Herrgård MJ, et al. A consensus yeast metabolic network reconstruction obtained from a community approach to systems biology. Nat Biotechnol. 2008;26:1155–1160. - PMC - PubMed
    1. Jeong H, Tombor B, Albert R, Oltvai ZN, Barabási A-L. The large-scale organization of metabolic networks. Nature. 2000;407:651–654. - PubMed
    1. Newman MEJ. Modularity and community structure in networks. Proc Natl Acad Sci. 2006;103:8577–8582. - PMC - PubMed

MeSH terms