. 2016 Oct 11;7(41):67251-67265.
doi: 10.18632/oncotarget.11625.

Oncogenic roles of the SETDB2 histone methyltransferase in gastric cancer

Affiliations

Oncogenic roles of the SETDB2 histone methyltransferase in gastric cancer

Taketo Nishikawaji et al. Oncotarget. .

Abstract

SETDB2 is a histone H3 lysine 9 (H3K9) tri-methyltransferase that is involved in transcriptional gene silencing. Since it is still unknown whether SETDB2 is linked to carcinogenesis, we studied alterations and functions of SETDB2 in human gastric cancers (GCs). SETDB2 protein was highly expressed in 30 of 72 (41.7%) primary GC tissues compared with their normal counterparts by immunohistochemistry. SETDB2 overexpression was significantly associated with the late stage of GCs (P<0.05) and poor prognosis of GC patients (P<0.05). The GC cell lines with SETDB2 knockdown and overexpression significantly decreased and increased cell proliferation, migration and invasion, respectively (P<0.05). Knockdown of SETDB2 in MKN74 and MKN45 cells reduced global H3K9 tri-methylation (me3) levels. Microarray analysis indicated that expression of WWOX and CADM1, tumor suppressor genes, was significantly enhanced in MKN74 cells after SETDB2 knockdown. Chromatin immunoprecipitation assays showed that the H3K9me3 levels at the promoter regions of these two genes corresponded to the SETDB2 expression levels in GC cells. Moreover, ectopic SETDB2 protein was recruited to their promoter regions. Our data suggest that SETDB2 is associated with transcriptional repression of WWOX and CADM1, and hence overexpression of SETDB2 may contribute to GC progression.

Keywords: H3K9me3; SETDB2; gastric cancer; histone methyltransferase.


Conflict of interest statement

CONFLICTS OF INTEREST

All authors declare that they have no conflict of interest to disclose.

Figures
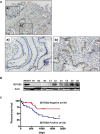
Figure 1
Figure 1. Analyses of SETDB2 protein expression in primary GC tissues
A. Immunohistochemical staining of SETDB2 protein expression. The staining is representative of 72 primary GC tissues. The images at bottom are magnifications of the boxed regions of non-cancerous (a) and tumor (b) tissues in the top image. B. Western blot analysis of the expression levels of SETDB2 protein in primary GC tissues and non-cancerous stomach tissues. Representative data are shown. Actin expression was analyzed as an internal control. Expression in the MKN74 cell lines was used as a positive control (Figure 2A). N; non-cancerous stomach tissue, C; human gastric cancer. C. Kaplan Meier analysis of overall survival of gastric cancer patients according to SETDB2 positive or negative expression in the tumor tissue (*: P<0.05).
Figure 2
Figure 2. Functional analyses of SETDB2 in cultured GC cell lines
A. Western blot analysis of the expression levels of SETDB2 protein in 13 GC cell lines. Actin expression was analyzed as an internal control. SETDB2 protein expression was quantified using Image J software, and then was normalized to Actin expression. GC cell lines were classified into SETDB2-high and -low expressing groups, which were determined by a cut-off value of 0.50. Accordingly, four GC cell lines highlighted in blue (high: HSC57, MKN7, MKN45 and MKN74) strongly expressed the SETDB2 protein, while the remaining nine cell lines exhibited no or weak SETDB2 expression (low). B. Western blot analysis of SETDB2 expression in GC cells with its knockdown. SETDB2 expression was suppressed in MKN74 and MKN45 cells by transfection with SETDB2 siRNA (siSETDB2) compared with ones with negative control siRNA (NC). Actin expression was used as an internal control. C. Cell proliferation was quantified with a Cell Counting Kit-8 after transfection of SETDB2 siRNA into MKN74 and MKN45 cells. ◆, (blue), negative control siRNA; ▲, (green), SETDB2 siRNA transfection. Data are from 3 replicate experiments and error bars indicate standard deviation. Student's t-test; **: P<0.01. D and E. The cell migration and invasion were assayed using a control insert (D) and a Matrigel invasion chamber (E), respectively, in MKN45 cells transfected with siSETDB2 or control siRNA. Original magnification: x100. Student's t-test; **: P<0.01. F. Western blot analysis of SETDB2 overexpression in GC cells. AGS and NUGC3 were transfected with the empty vector (Empty) or the SETDB2 overexpressing vector (pSETDB2). Actin expression was analyzed as an internal control. G. Analysis of the cell proliferation of AGS and NUGC3 cells transfected with the SETDB2 overexpressing (▲, red), or the empty (◆, blue) vector. Data are from 3 replicate experiments and the error bars indicate standard deviation. Student's t-test; **: P<0.01. H and I. Analyses of cell migration and invasion abilities in AGS and NUGC3 with SETDB2 overexpression using a control insert (H) and a Matrigel invasion chamber (I). Original magnification: x100. Student's t-test; *: P<0.05.
Figure 3
Figure 3. Analyses of the SETDB2 target genes in GC cells
A. Western blot analysis of the global H3K9 methylation levels of MKN74 and MKN45 cells transfected with SETDB2 (siSETDB2) or control (NC) siRNA. B. After knockdown of SETDB2 in MKN74 cells, expressionaly altered six genes were selected as its downstream targets detected by microarray analysis. The mRNA expression levels of these genes were validated by real-time RT-PCR in MKN74 and MKN45 after knockdown of SETDB2. The white bars are cell lines transfected negative control siRNA and the black bars are cell lines transfected SETDB2 siRNA.
Figure 4
Figure 4. ChIP analysis of the promoter region of WWOX and CADM1 expression in GC cells
A. Schematic representation of the promoter region of the WWOX gene. ChIP assay was performed at the regions of the promoter (−493 to -325) and gene body (+3040 to +3206). B. ChIP assay was performed with anti-histone H3 and anti-H3K9me3 polyclonal antibodies, and normal rabbit IgG. The H3K9me3 levels were enriched at the WWOX promoter region (−493 to −325) in MKN74 and MKN45 cells with negative control transfection (NC) compared with ones with siSETDB2 transfection. The H3K9me3 was not detected at the gene body region (+3040 to +3206). Input DNA sample was used as an internal control. C. Schematic representation of the promoter region of the CADM1 gene. D. ChIP assay was performed at the regions of the CADM1 promoter (−359 to −207) and gene body (+3085 to +3289). E) H3K9me3 levels and SETDB2 binding at the promoter regions of WWOX and CADM1 in AGS cells with SETDB2 overexpression.
Figure 5
Figure 5. The relationship between SETDB2 and target gene expression in GC cell lines
A. The expression levels of WWOX, CADM1 and CCDC80 mRNA were examined in 13 GC cell lines using real-time RT-PCR. The black bars are cell lines with high SETDB2 protein expression and the white bars are cell lines with low SETDB2 protein expression. B. WWOX protein expression levels were examined by Western blotting in GC cells with SETDB2 knockdown (left), and overexpression (right). Actin expression was analyzed as an internal control.
Figure 6
Figure 6. Functional analysis of WWOX in GC cells
A. Western blot analysis of WWOX protein expression in AGS and NUGC3 cells transfected with negative control (NC) or WWOX siRNA (siWWOX). B. Cell proliferation was quantified with the Cell Counting Kit-8 after transfection of WWOX siRNA (▲, red) or negative control siRNA (◆, blue) into GC cells. Data are from 3 replicate experiments and error bars indicate standard deviation. Student's t-test; **: P<0.01. C and D. The cell migration (C) and the invasion (D) abilities of AGS and NUGC3 cells with WWOX siRNA were assayed using a control insert and a Matrigel invasion chamber, respectively. Original magnification: x100. Student's t-test; *: P<0.05, **: P<0.01.

Similar articles

Cited by

References

    1. Ferlay J, Soerjomataram I, Dikshit R, Eser S, Mathers C, Rebelo M, Parkin DM, Forman D, Bray F. Cancer incidence and mortality worldwide: sources, methods and major patterns in GLOBOCAN 2012. Int J Cancer. 2015;136:E359–386. - PubMed
    1. Yuasa Y. Control of gut differentiation and intestinal-type gastric carcinogenesis. Nat Rev Cancer. 2003;3:592–600. Review. - PubMed
    1. Wanajo A, Sasaki A, Nagasaki H, Shimada S, Otsubo T, Owaki S, Shimizu Y, Eishi Y, Kojima K, Nakajima Y, Kawano T, Yuasa Y, Akiyama Y. Methylation of the calcium channel-related gene, CACNA2D3, is frequent and a poor prognostic factor in gastric cancer. Gastroenterology. 2008;35:580–590. - PubMed
    1. Albert M, Helin K. Histone methyltransferases in cancer. Semin Cell Dev Biol. 2010;21:209–220. - PubMed
    1. Rodriguez-Paredes M, Martinez de Paz A, Simó-Riudalbas L, Sayols S, Moutinho C, Moran S, Villanueva A, Vázquez-Cedeira M, Lazo PA, Carneiro F, Moura CS, Vieira J, Teixeira MR, et al. Gene amplification of the histone methyltransferase SETDB1 contributes to human lung tumorigenesis. Oncogene. 2014;33:2807–2813. - PMC - PubMed