

Environmental DNA reveals that rivers are conveyer belts of biodiversity information
- PMID: 27572523
- PMCID: PMC5013555
- DOI: 10.1038/ncomms12544
Environmental DNA reveals that rivers are conveyer belts of biodiversity information
Abstract
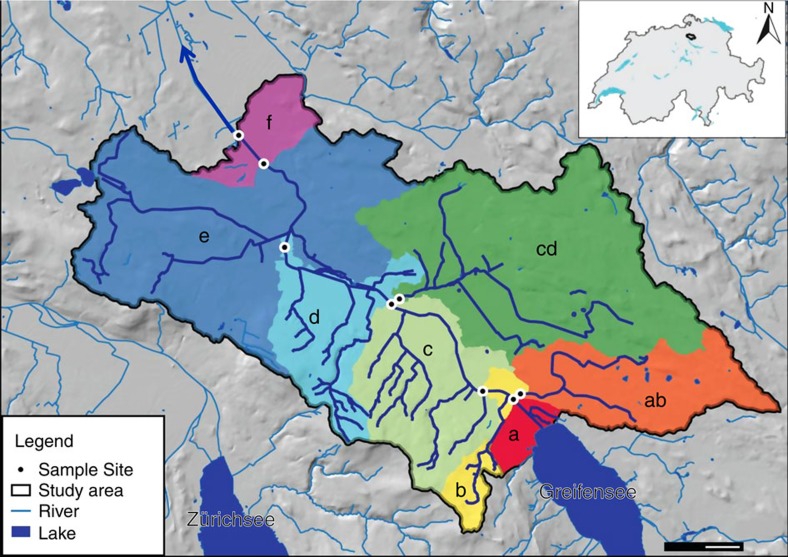
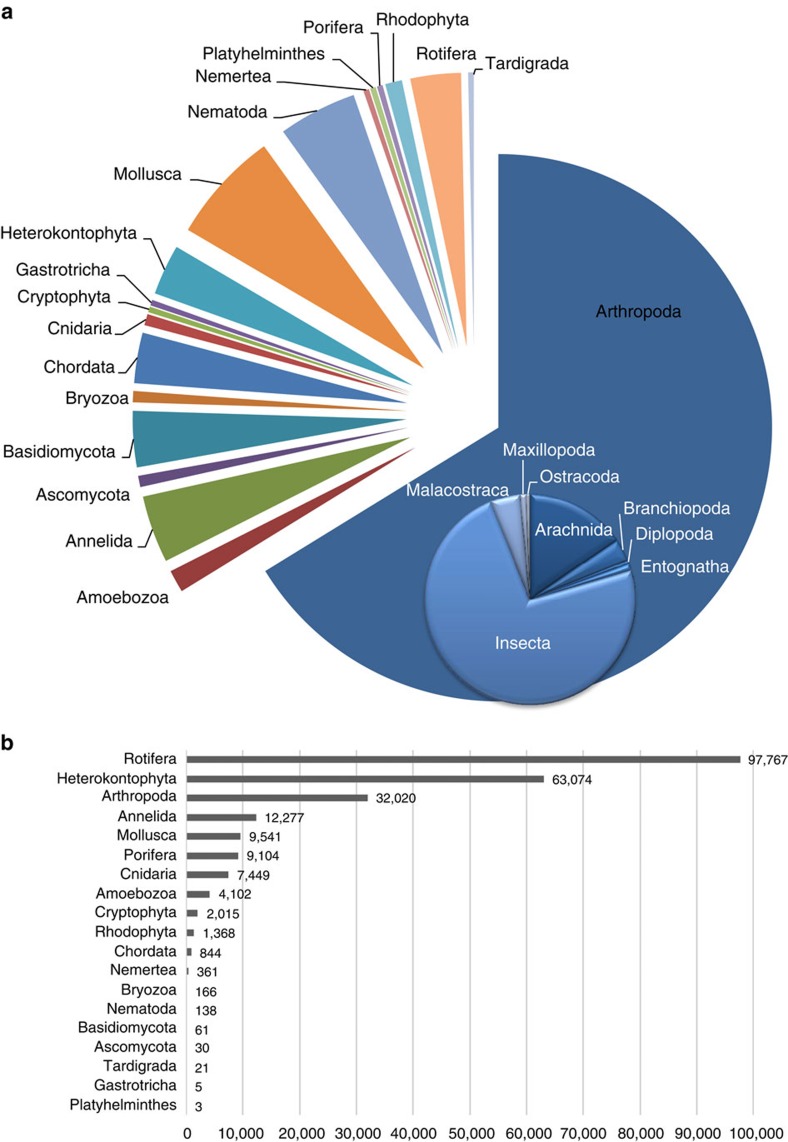
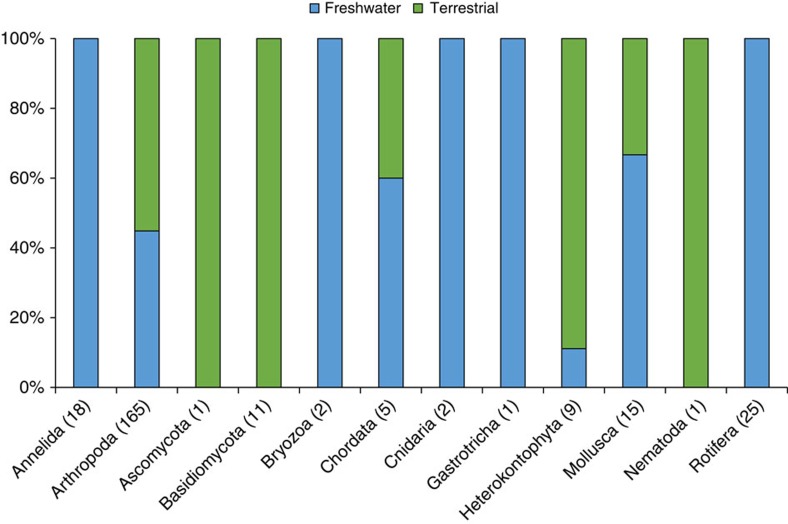
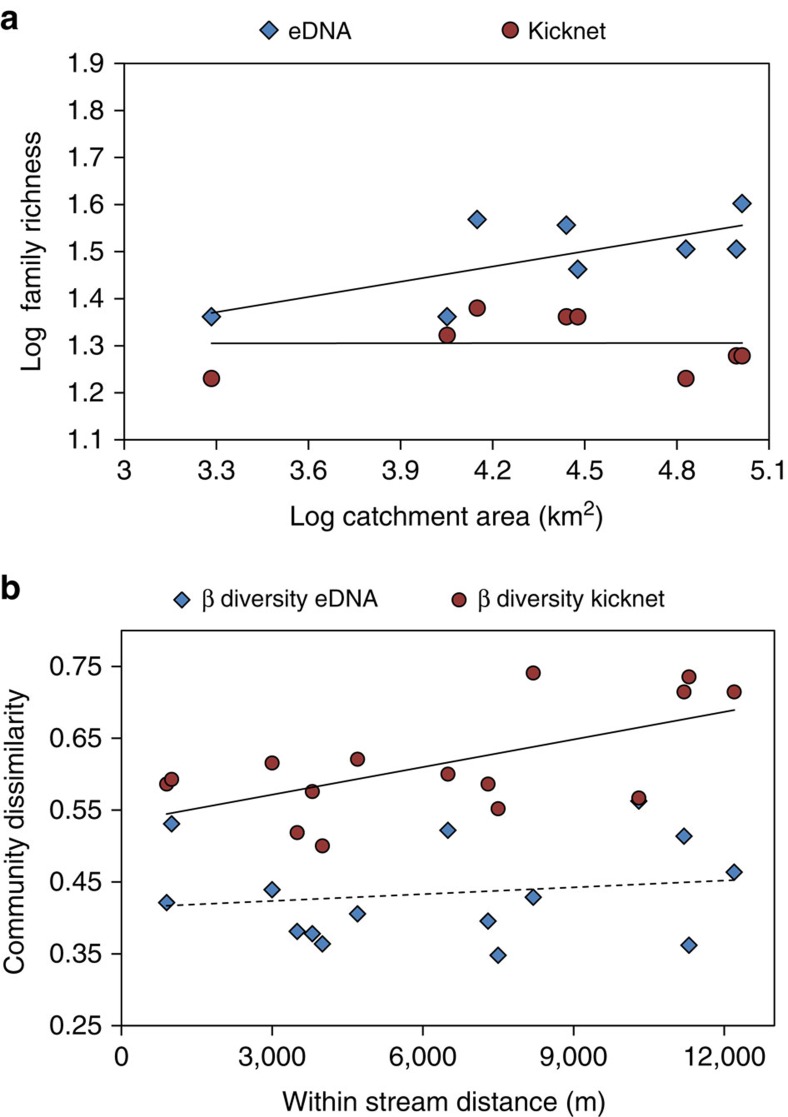
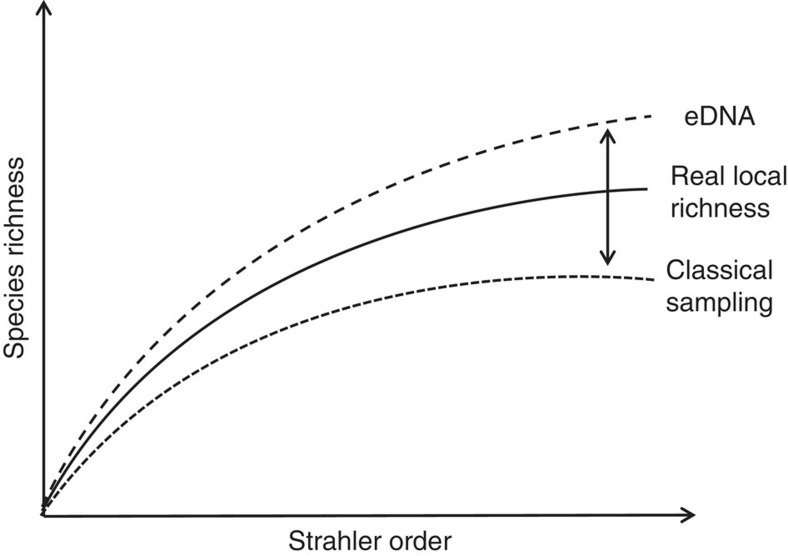
DNA sampled from the environment (eDNA) is a useful way to uncover biodiversity patterns. By combining a conceptual model and empirical data, we test whether eDNA transported in river networks can be used as an integrative way to assess eukaryotic biodiversity for broad spatial scales and across the land-water interface. Using an eDNA metabarcode approach, we detect 296 families of eukaryotes, spanning 19 phyla across the catchment of a river. We show for a subset of these families that eDNA samples overcome spatial autocorrelation biases associated with the classical community assessments by integrating biodiversity information over space. In addition, we demonstrate that many terrestrial species are detected; thus suggesting eDNA in river water also incorporates biodiversity information across terrestrial and aquatic biomes. Environmental DNA transported in river networks offers a novel and spatially integrated way to assess the total biodiversity for whole landscapes and will transform biodiversity data acquisition in ecology.
Figures
Similar articles
-
Effectiveness assessment of using riverine water eDNA to simultaneously monitor the riverine and riparian biodiversity information.Sci Rep. 2021 Dec 20;11(1):24241. doi: 10.1038/s41598-021-03733-7. Sci Rep. 2021. PMID: 34930992 Free PMC article.
-
Catchment-based sampling of river eDNA integrates terrestrial and aquatic biodiversity of alpine landscapes.Oecologia. 2023 Aug;202(4):699-713. doi: 10.1007/s00442-023-05428-4. Epub 2023 Aug 9. Oecologia. 2023. PMID: 37558733 Free PMC article.
-
Environmental DNA reveals quantitative patterns of fish biodiversity in large rivers despite its downstream transportation.Sci Rep. 2018 Jul 10;8(1):10361. doi: 10.1038/s41598-018-28424-8. Sci Rep. 2018. PMID: 29991759 Free PMC article.
-
Environmental DNA metabarcoding: Transforming how we survey animal and plant communities.Mol Ecol. 2017 Nov;26(21):5872-5895. doi: 10.1111/mec.14350. Epub 2017 Oct 26. Mol Ecol. 2017. PMID: 28921802 Review.
-
Environmental DNA as an emerging tool in botanical research.Am J Bot. 2023 Feb;110(2):e16120. doi: 10.1002/ajb2.16120. Epub 2023 Feb 3. Am J Bot. 2023. PMID: 36632660 Review.
Cited by
-
eDNAir: proof of concept that animal DNA can be collected from air sampling.PeerJ. 2021 Mar 31;9:e11030. doi: 10.7717/peerj.11030. eCollection 2021. PeerJ. 2021. PMID: 33850648 Free PMC article.
-
Environmental DNA captures native and non-native fish community variations across the lentic and lotic systems of a megacity.Sci Adv. 2022 Feb 11;8(6):eabk0097. doi: 10.1126/sciadv.abk0097. Epub 2022 Feb 11. Sci Adv. 2022. PMID: 35148174 Free PMC article.
-
Rivers as carriers and potential sentinels for Burkholderia pseudomallei in Laos.Sci Rep. 2018 Jun 6;8(1):8674. doi: 10.1038/s41598-018-26684-y. Sci Rep. 2018. PMID: 29875361 Free PMC article.
-
A comparative study on eDNA-based detection of Siamese bat catfish (Oreoglanis siamensis) in wet and dry conditions.Sci Rep. 2024 Apr 17;14(1):8885. doi: 10.1038/s41598-024-58752-x. Sci Rep. 2024. PMID: 38632301 Free PMC article.
-
Environmental DNA preserved in marine sediment for detecting jellyfish blooms after a tsunami.Sci Rep. 2021 Aug 20;11(1):16830. doi: 10.1038/s41598-021-94286-2. Sci Rep. 2021. PMID: 34417484 Free PMC article.
References
-
- Vörösmarty C. J. et al.. Global threats to human water security and river biodiversity. Nature 467, 555–561 (2010). - PubMed
-
- Willett S. D., McCoy S. W., Perron J. T., Goren L. & Chen C.-Y. Dynamic reorganization of river basins. Science 343, 1248765 (2014). - PubMed
-
- Rodríguez-Iturbe I. & Rinaldo A. Fractal River Basins: chance and Self-Organization Cambridge University Press (1997).
-
- Clift P. D. & Blusztajn J. Reorganization of the western Himalayan river system after five million years ago. Nature 438, 1001–1003 (2005). - PubMed
-
- Ward N. D. et al.. Degradation of terrestrially derived macromolecules in the Amazon River. Nat. Geosci. 6, 530–533 (2013).
Publication types
MeSH terms
Substances
LinkOut - more resources
Full Text Sources
Other Literature Sources
