Review
. 2016:579:51-86.
doi: 10.1016/bs.mie.2016.04.011. Epub 2016 Jun 16.

Specimen Preparation for High-Resolution Cryo-EM

Affiliations
Review

Specimen Preparation for High-Resolution Cryo-EM

L A Passmore et al. Methods Enzymol. 2016.

Abstract

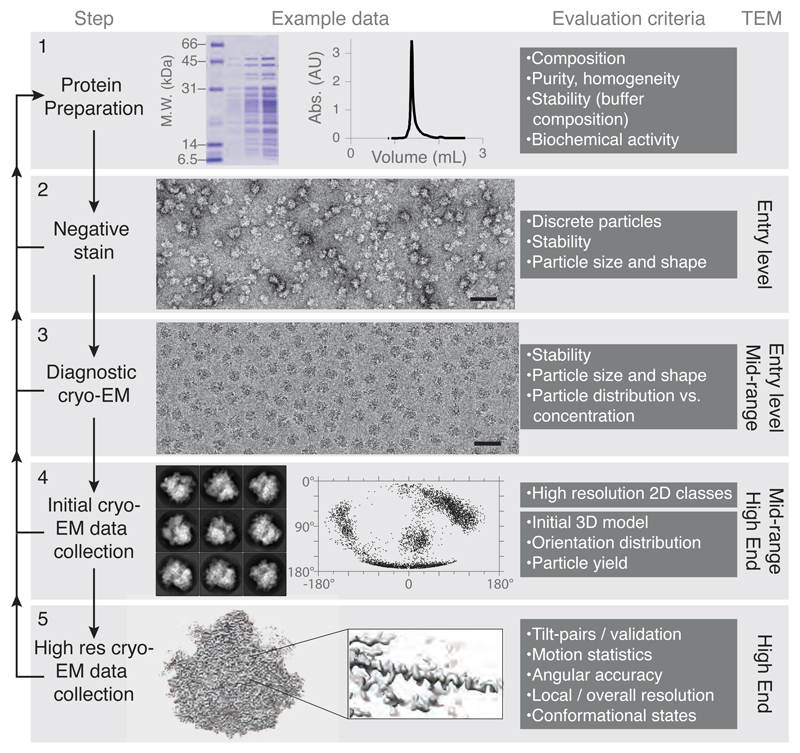
Imaging a material with electrons at near-atomic resolution requires a thin specimen that is stable in the vacuum of the transmission electron microscope. For biological samples, this comprises a thin layer of frozen aqueous solution containing the biomolecular complex of interest. The process of preparing a high-quality specimen is often the limiting step in the determination of structures by single-particle electron cryomicroscopy (cryo-EM). Here, we describe a systematic approach for going from a purified biomolecular complex in aqueous solution to high-resolution electron micrographs that are suitable for 3D structure determination. This includes a series of protocols for the preparation of vitrified specimens on various supports, including all-gold and graphene. We also describe techniques for troubleshooting when a preparation fails to yield suitable specimens, and common mistakes to avoid during each part of the process. Finally, we include recommendations for obtaining the highest quality micrographs from prepared specimens with current microscope, detector, and support technology.

Keywords: Cryo-EM; Electron cryo-microscopy; Electron tomography; Protein structure; Single-particle reconstruction; Substrates.


Figures

Figure 1
Figure 1. Structure determination by cryo-EM.
A systematic approach to 3D structure determination is shown. In the left column, the major steps are listed. Each step should be performed successively and only after one has been completed successfully should the scientist move onto the next step. In the second column, example data are shown for ribosomes (details in text). Scale bars on the micrographs are 500 Å. Each step should be evaluated with the criteria listed in the third column, returning to earlier steps for troubleshooting. The final column lists the class of electron microscope to be used, as defined in Table 1.
Figure 2
Figure 2. Supports for cryo-EM.
Here we show a support comprising a 3 mm metal mesh grid (A) with a perforated gold foil covering the surface of the mesh (B,C). Thin films (∼2–30 Å thick) can be added on top of the perforated foil. Scale bars are (A) 0.5 mm (B) 50 μm and (C) 5 μm.
Figure 3
Figure 3. Tweezer damage to specimen supports
Bent tweezers (A) or improper use (B) results in damage to the specimen support. For best results, sharp, straight tweezers (C) should be used and supports should be picked up by the rim only (D). For Panels A and C, the scale bars are 1 mm. For Panels B and D, the scale bars are 100 μm.
Figure 4
Figure 4. Storing grids to avoid contamination and static charge
Panel A shows bad practice in grid handling: The use of gloves and plastic storage dishes results in the accumulation of static charge. In the image, a charged grid is standing on end. Panel B shows recommended handling procedures including glass containers, no glove on the hand holding the tweezers and a wrist grounding strap to prevent accumulation of charge.
Figure 5
Figure 5. Removing surface contamination from specimen supports
Supports can be washed sequentially (A) in chloroform, acetone and isopropanol. Care must be taken to avoid deposition of contamination from the surface of water (or solvents) onto the support. A schematic is shown in panel B. Overfilling of containers can reduce surface contamination, shown in panel C. Scale bars are 20 mm.
Figure 6
Figure 6. Apparatus for depositing thin films of amorphous carbon on supports.
Panel A shows a cross-sectional diagram of the float chamber. As the water level is lowered, the thin film of amorphous carbon is deposited onto the supports. The stainless steel ring makes a positive meniscus to help lower the carbon film down in the center of the ring. Panel B shows a photo of the apparatus in use. This figure is reproduced from (Russo and Passmore, 2016b).
Figure 7
Figure 7. Graphene transfer onto supports with carbon foils.
The process is diagrammed in Panel A. Panels B and C show copper heated to 150°C for 10 min in air, where B is fully covered in graphene so does not oxidise while C has no graphene and turns color due to oxidisation; scale bars are 3 mm. This simple test is used to map the location of the graphene on the foil. Panels D and E show the grid-graphene-copper sandwich, scale bars are 1 mm and 10 μm respectively. Panel F is the sandwich floating in the etchant, where the partially etched grains of copper are visible (scale 1 mm). Panel G is an electron diffraction pattern of suspended graphene with ice, where the arrow points to the 2.1 Å reflection from the graphene lattice.
Figure 8
Figure 8. Plasmas generated by glow discharge.
Residual air plasma generation by three different instruments is shown. All are effective in increasing hydrophilicity of support surfaces but have varying degrees of reproducibility and can damage the supports. Note that the plasmas in glow discharge apparatuses are often non-uniform which can vary the exposure dose significantly, even in a single batch. Scale bars are 20 mm.
Figure 9
Figure 9. Generation of defined plasmas for surface modification.
(A,B) The Fischione Model 1070 and Gatan Solarus generate plasmas with defined compositions. (C) Photo (top) and diagram (bottom) of a custom specimen holder made at MRC LMB. Two different holder designs are shown - one is used for exposure of one side of a support, the other is used for exposure of both sides. The lid is used to prevent the supports from moving during the process. (D) Diagram of plasma generation.
Figure 10
Figure 10. Vitrification and mounting of grids.
(A) Supports that are bent will be damaged upon cryo plunging, resulting in broken foils. An example of a broken gold foil is shown in panel B (scale bar 2 μm). Supports also need to be mounted correctly in microscope cartridges. Panel C shows a support that is incorrectly mounted, and so damaged, in a Krios cartridge. The support in panel D is correctly mounted. Scale bars in panels C and D are 500 μm.
Figure 11
Figure 11. Testing for specimen movement during or after data collection
Large amounts of specimen movement or stage drift can be detected during data acquisition using real-time fast Fourier transforms (FFTs) of the collected micrographs. FFTs of specimens are shown with no stage drift (A) and 10 Å/sec temperature induced stage drift (B). Micrograph C shows the recommended, symmetric illumination of a frozen specimen suspended across a hole in an all-gold support foil. Histogram is the in-plane movement statistics for 1 second micrographs (16 e2) on all-gold supports vs. amorphous carbon on gold (Quantifoil) under the same symmetric illumination conditions shown in C. Inset is enlargement of histogram near origin.

References

    1. Adrian M, Dubochet J, Lepault J, McDowall AW. Cryo-electron microscopy of viruses. Nature. 1984;308(5954):32–36. - PubMed
    1. Baker LA, Watt IN, Runswick MJ, Walker JE, Rubinstein JL. Arrangement of subunits in intact mammalian mitochondrial ATP synthase determined by cryo-EM. Proceedings of the National Academy of Sciences. 2012;109(29):11675–11680. - PMC - PubMed
    1. Bernecky C, Herzog F, Baumeister W, Plitzko JM, Cramer P. Structure of transcribing mammalian RNA polymerase II. Nature. 2016;529(7587):551–554. - PubMed
    1. Brenner S, Horne R. A negative staining method for high resolution electron microscopy of viruses. Biochimica et Biophysica Acta. 1959;34:103–110. - PubMed
    1. Chen B, Kaledhonkar S, Sun M, Shen B, Lu Z, Barnard D, Lu T-M, Gonzalez RL, Frank J. Structural dynamics of ribosome subunit association studied by mixing-spraying time-resolved cryogenic electron microscopy. Structure. 2015;23(6):1097–1105. - PMC - PubMed

Publication types