. 2016 May 27;1(7):16069.
doi: 10.1038/nmicrobiol.2016.69.

Influenza virus mRNA trafficking through host nuclear speckles

Affiliations

Influenza virus mRNA trafficking through host nuclear speckles

Amir Mor et al. Nat Microbiol. .

Erratum in

Abstract

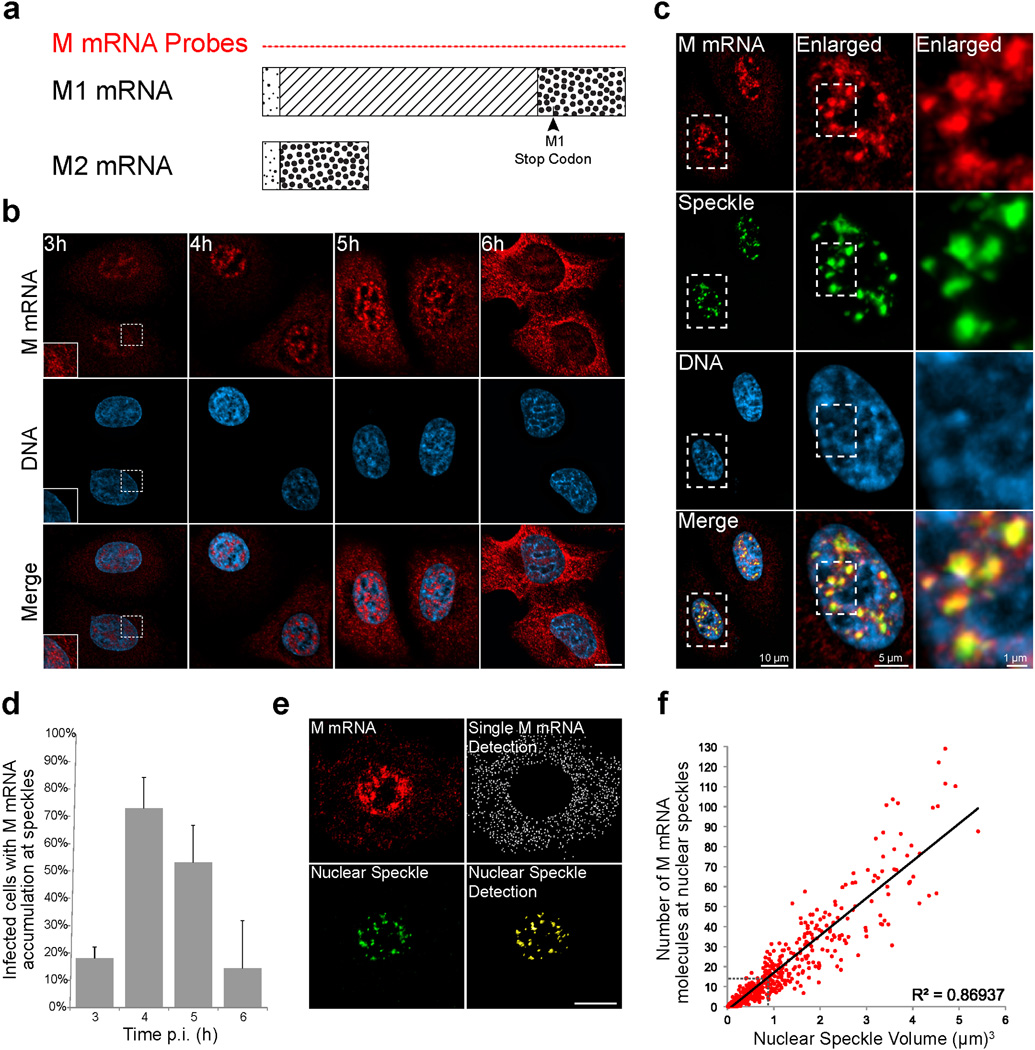
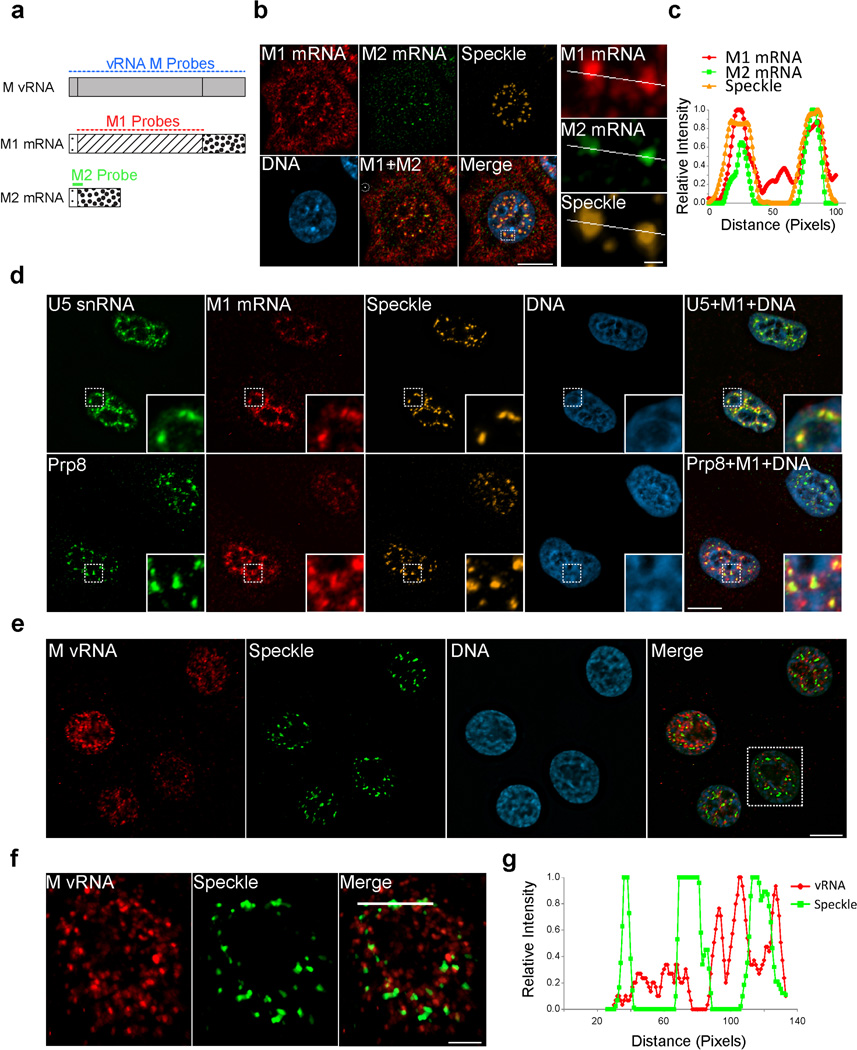
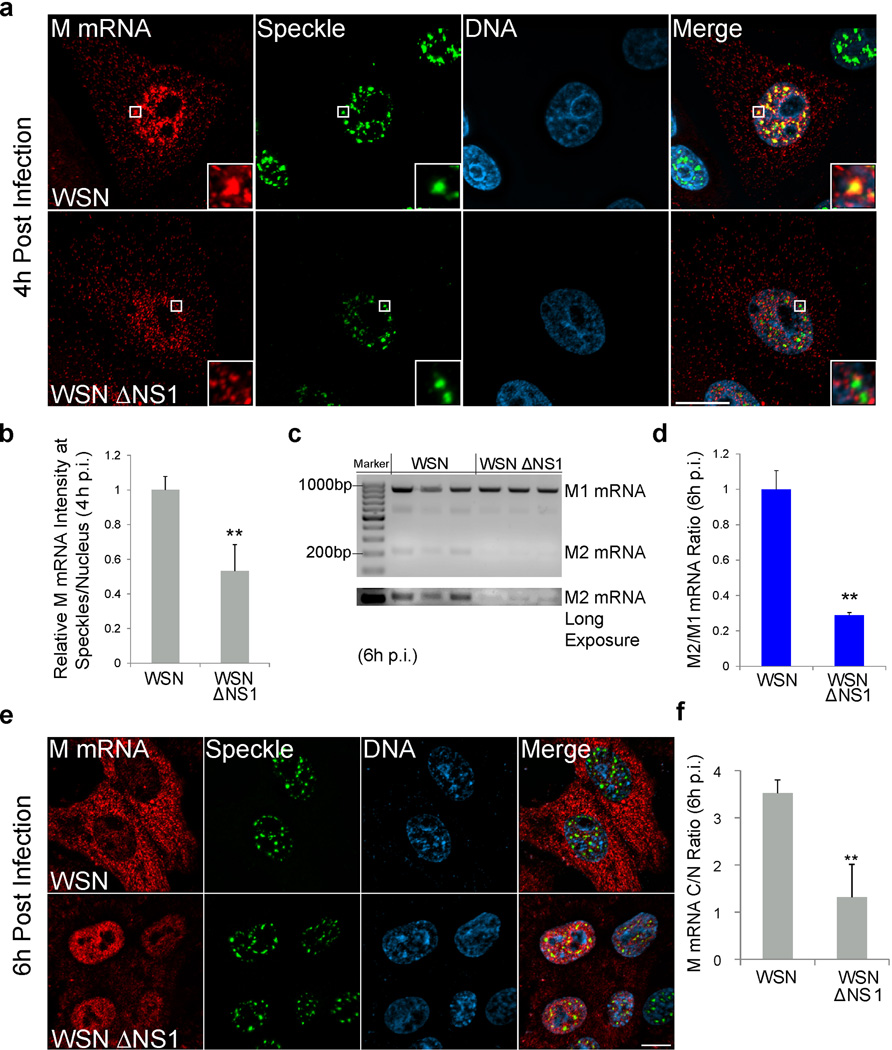
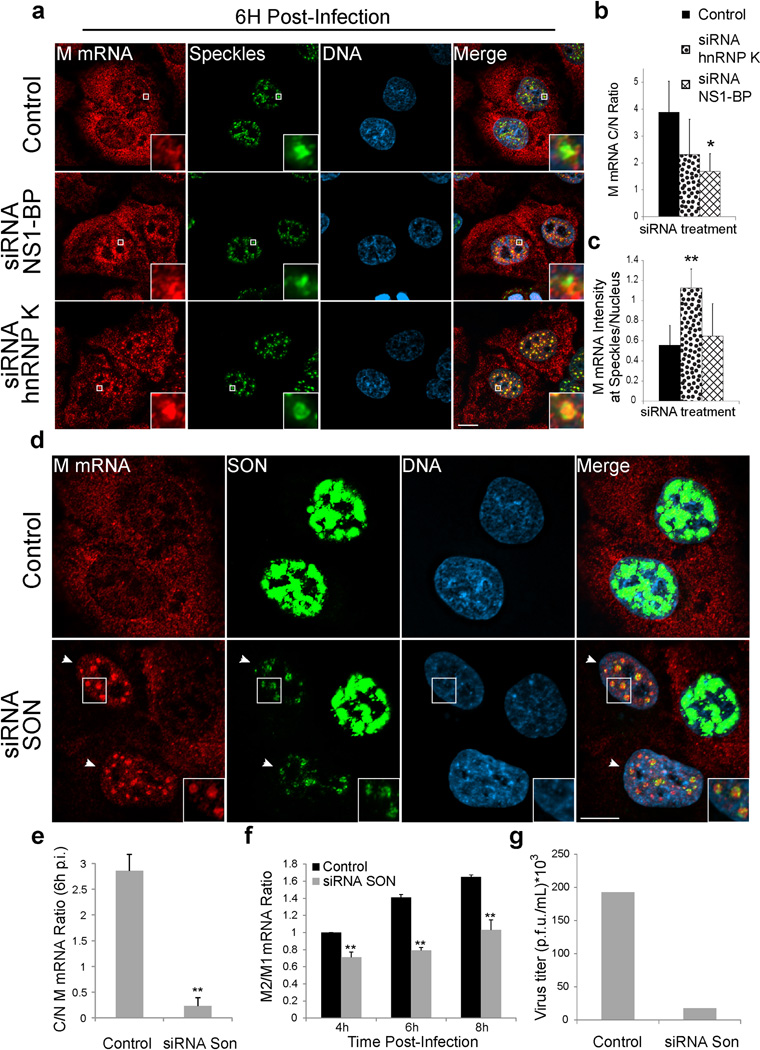
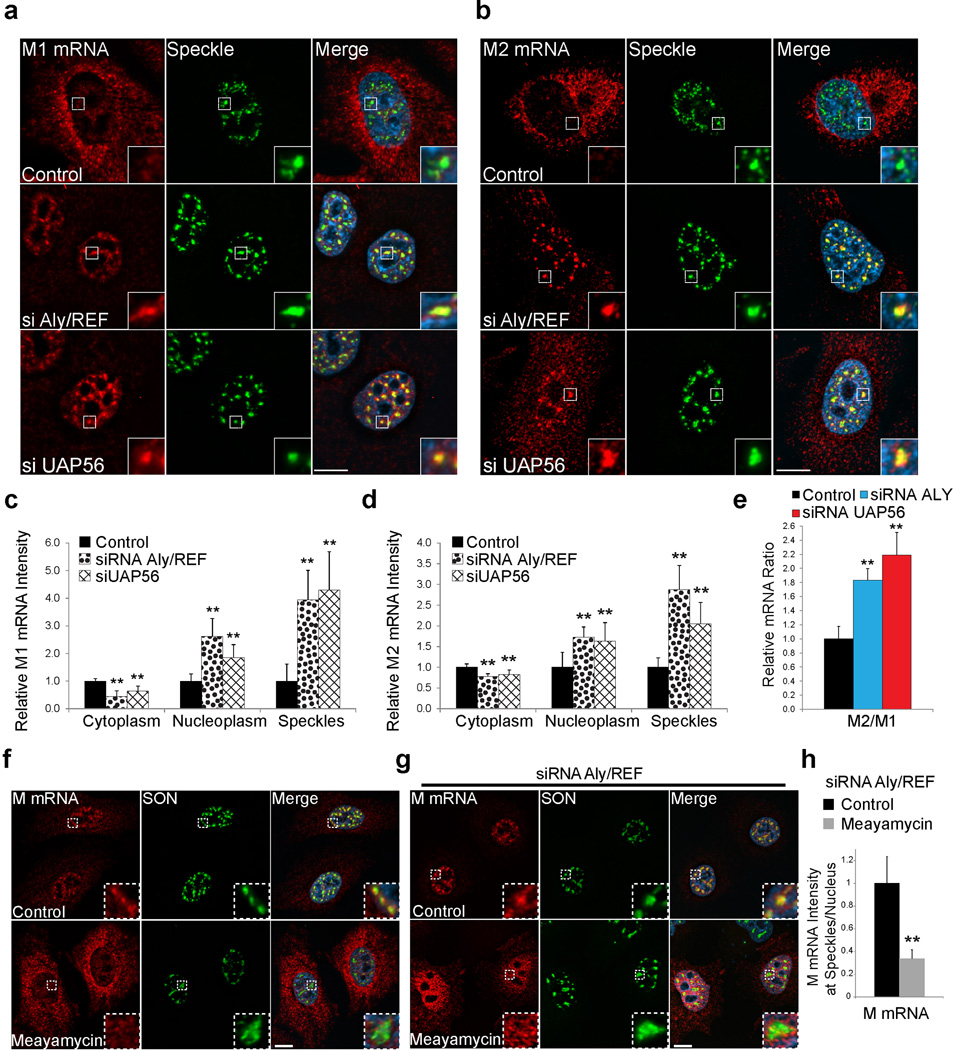
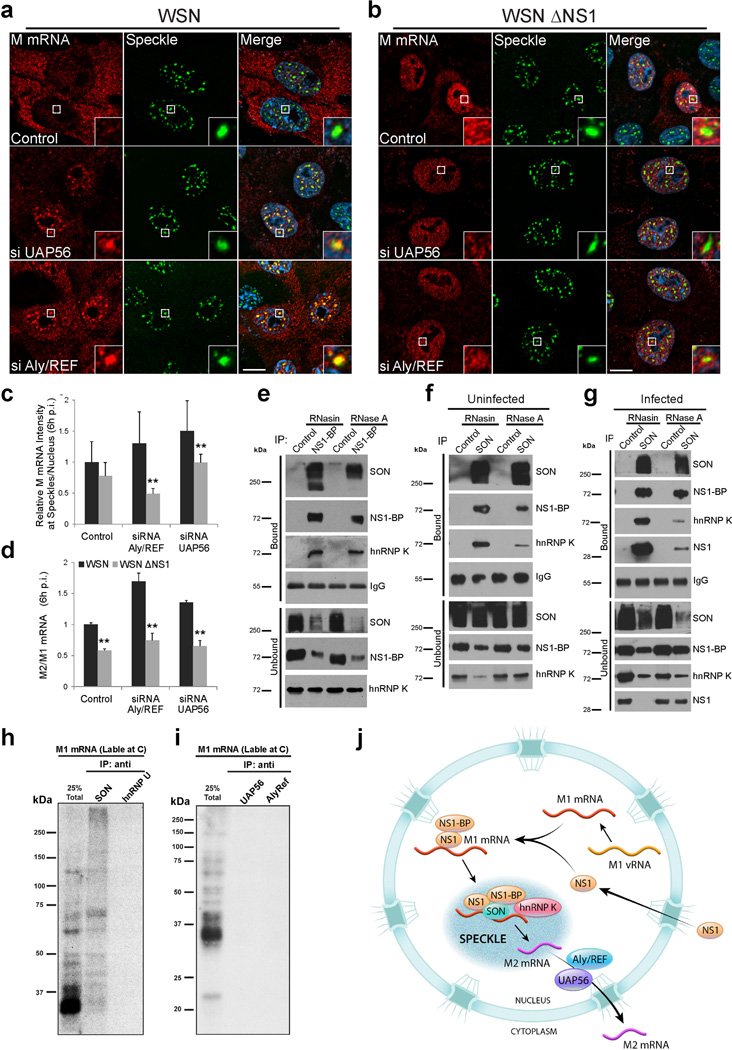
Influenza A virus is a human pathogen with a genome composed of eight viral RNA segments that replicate in the nucleus. Two viral mRNAs are alternatively spliced. The unspliced M1 mRNA is translated into the matrix M1 protein, while the ion channel M2 protein is generated after alternative splicing. These proteins are critical mediators of viral trafficking and budding. We show that the influenza virus uses nuclear speckles to promote post-transcriptional splicing of its M1 mRNA. We assign previously unknown roles for the viral NS1 protein and cellular factors to an intranuclear trafficking pathway that targets the viral M1 mRNA to nuclear speckles, mediates splicing at these nuclear bodies and exports the spliced M2 mRNA from the nucleus. Given that nuclear speckles are storage sites for splicing factors, which leave these sites to splice cellular pre-mRNAs at transcribing genes, we reveal a functional subversion of nuclear speckles to promote viral gene expression.

Keywords: influenza virus; mRMA export; nuclear speckles; splicing.


Figures

Figure 1
Figure 1. Influenza M mRNA is localized at nuclear speckles
(a) Schematic representation of M1 and M2 mRNAs. The diagonal lines in M1 mRNA represent an intron that is spliced out to generate M2 mRNA. Forty-six FISH probes labeled with Quasar 570 (M mRNA Probes) that cover the entire M1 and M2 mRNAs were synthesized. (b) These probes monitored the distribution of M mRNA at 3h, 4h, and 6h during A/WSN/33 infection of A549 cells at MOI 10. Inset shows enlargement of an area in the nucleus and cytoplasm. Images are representative of three independent experiments. Scale Bar = 10µm. (c) M mRNA accumulates at nuclear speckles, which were marked by SC35 immunofluorescence staining (Pearson’s Correlation Coefficient between the M mRNA channel and the Speckle channel in the nucleus = 0.72). The squared marked region was enlarged and shown in the middle panel. Further enlargement is shown in the right panel. Images are representative of three independent experiments. (d) The percentage of cells with speckle mRNA accumulation was quantified. Values are percentage mean ± s.d. of at least 99 cells that were counted in three independent experiments for each time point. p.i.- post infection. (e) M mRNA quantification at nuclear speckles. Fluorescent signal emerging from labeled M mRNA transcripts was detected in the cytoplasm (Single M mRNA Detection, white dots) while the M mRNA signal emerging from the nucleus was masked based on Hoechst staining. Nuclear speckles were also marked (Nuclear Speckle Detection, yellow punctate). Images are representative of three independent experiments. Scale Bar = 10µm. (f) Quantification of M mRNA copy number at nuclear speckles marked with SC35 antibody. M mRNA fluorescence intensity sum inside speckles was divided by the average intensity sum of individual cytoplasmic M mRNA transcripts. Cells were infected for 4 h and RNA-FISH was quantified as in e. The number of M mRNA at nuclear speckles was plotted according to the nuclear speckle volume. Dotted lines in the graph depict the average nuclear speckle volume and the corresponding M mRNA copy number. Six hundred and eighty two nuclear speckles were analyzed in 16 cells.
Figure 2
Figure 2. M1 mRNA and spliced M2 mRNA accumulate at nuclear speckles after transcription
(a) Schematic representation of 3 sets of probes that were synthesized to specifically detect the M vRNA, and M1 and M2 mRNAs. Forty-six FISH probes labeled with Quasar 670 were synthesized to label the entire M vRNA segment. Thirty-one FISH probes labeled with Quasar 670 were synthesized to cover the M1 mRNA intron region. The M2 mRNA was detected using a single probe labeled with 2 Quasar 570 Fluorophores. This probe binds the exon junction region of M2 mRNA. (b) M1 and M2 probes were used in RNA FISH experiments performed at 4 h post-infection. Nuclear speckles were marked with SC35 antibody. A single cell was enlarged in order to demonstrate the M1 and M2 mRNA enrichment at nuclear speckles. The squared region shown in Merge was further enlarged and the M1, M2 and Speckle channels are shown on the right. (c) Relative intensity of the three channels along the white line is shown in the graph. (d) U5 snRNP components, U5 snRNA and Prp8, were co-labeled with M1 mRNA at 4 h post-infection. Nuclear speckles were marked with SC35 antibody (top) or SON antibody (bottom). (e) M vRNA probes were used in RNA FISH experiments performed at 4h post-infection. Nuclear speckles were marked with SC35 antibody. (f) The square region marked in e-Merge was enlarged and M vRNA, Speckle, and Merge are shown. (g) Relative intensity of the M vRNA and Speckle signal along the white line is shown in f-Merge. Images shown in b,d,e and f are representative of three independent experiments. Scale bar in b right panel = 1µm. Scale bar in f= 5µM. All other scale bars = 10µm.
Figure 3
Figure 3. Viral NS1 protein promotes M1 mRNA splicing at nuclear speckles and nuclear export
(a) VERO cells were infected with WSN virus or mutated virus that lack NS1 (WSN ΔNS1) at MOI 10. After 4h, cells were fixed and M mRNA was labeled by RNA-FISH. Speckles were marked by immunofuorescence with SON antibody. Insets are enlargements of the marked white squares showing nuclear speckle areas. Scale Bar = 10µm. (b) Quantification performed as in Supplementary Fig. 3a for measuring M mRNA intensity at speckles after WSN or WSN ΔNS1 infection. Data represents three independent experiments. M mRNA intensity sum at speckles was normalized to the intensity sum in the nucleus. Normalized intensities at speckles of WT virus infected cells were set to 1 and the relative fold change in WSN ΔNS1 virus infected cells is shown. Values are mean ± s.d. measured in 25 WSN and 29 WSN ΔNS1 infected cells. p.i.- post infection. (c) VERO cells were infected with WSN virus or WSN ΔNS1 at MOI 1 for 6 h. Purified RNA was subjected to RT-PCR and the products were run on agarose gel. Data represents three independent experiments. (d) RT-qPCR quantification of M2/M1 mRNA ratio in WSN or WSN ΔNS1 VERO infected cells. The average M2/M1 mRNA ratio from cells infected with WSN (M2/M1 mRNA = 0.62) was set to 1 and the relative average M2/M1 mRNA ratio in WSN ΔNS1 infected cells is shown. Values are mean ± s.d. ratios from three independent experiments. (e) VERO cells were infected with WSN virus or WSN ΔNS1. After 6h, cells were fixed and M mRNA was labeled by RNA-FISH. Speckles were marked by immunofluorescence with SON antibody. Scale Bar = 10µm. (f) Quantification was performed as shown in Supplementary Fig. 3a and M mRNA cytoplasmic to nuclear ratio (C/N) was determined after 6h of WSN or WSN ΔNS1 infection. Values are mean ± s.d. measured in 41 WSN and 50 WSN ΔNS1 infected cells. Scale Bar = 10µm. Images shown in a and e are representative of three independent experiments.** T test p value < 0.01.
Figure 4
Figure 4. M mRNA splicing at nuclear speckles is mediated by the host factors NS1-BP, hnRNP K and SON
(a) A549 cells were transfected with control siRNA, hnRNP K siRNA, or NS1-BP siRNA. After 72h, cells were infected with WSN at MOI 10 for 6 h. Cells were then fixed for M mRNA labeling by RNA-FISH. Nuclear speckles were marked with SON antibody. Insets show an enlarged nuclear speckle region. Scale Bar = 10µm. (b–c) Distribution of M mRNA in the nuclear and cytoplasmic compartments (b) and at speckles (c) was quantified as shown in Supplementary Figure 3a. Values are mean ± s.d. of at least 20 cells that were analyzed for each treatment. (d) A549 cells were transfected with control siRNA or SON siRNA. After 48h, cells were infected with WSN at MOI 10 for 6h. Cells were subjected to RNA-FISH. Nuclear speckles were marked with SON antibody. SON signal was intensified to show the abnormal speckle structure that form in SON depleted cells (marked by white arrows). Insets from cells depleted of SON show an enlarged area with abnormally shaped nuclear speckles. Scale Bar = 10µm. (e) Quantification of M mRNA cytoplasmic to nuclear ratios (C/N ratios). Values are mean ± s.d. measured in 61 cells transfected with control siRNA and in 27 cells transfected with SON siRNA and infected with WSN. p.i.- post infection. (f) RT-qPCR quantification of M2/M1 mRNA ratios from cells transfected with control siRNA or SON siRNA and infected for 4h, 6h, and 8h. The average M2/M1 mRNA ratio from cells treated with control siRNA at 4h post-infection (M2/M1 mRNA = 0.59) was set to 1 and the relative average M2/M1 mRNA ratios at the depicted time points are shown. Values are mean ± s.d. from three independent experiments. (g) WSN replication was determined after 24h in control cells or in SON depleted cells. Virus titer was determined by plaque assay. Values are mean from two independent experiments. Images shown in a and d are representative of three independent experiments.* T test p value < 0.05, ** T test p value < 0.01.
Figure 5
Figure 5. Aly/REF and UAP56 depletion inhibits M1 and M2 mRNA nuclear export and mediates speckle dependent M1 to M2 splicing enhancement
(a and b) A549 cells were transfected with control siRNA, Aly/REF siRNA, or UAP56 siRNA. After 48h, cells were infected with WSN at MOI 10 for 6h. M1 (a) and M2 (b) mRNA labeling was performed by RNA-FISH. Nuclear speckles were marked with SON antibody. (c and d) Distribution of M1 (c) and M2 (d) mRNAs in the cytoplasm, nucleoplasm, and nuclear speckles was quantified as in Supplementary Figure 3a. Intensity sum in each compartment was normalized to the general fluorescence intensity in the cell. Values obtained from cells transfected with control siRNA were set to 1 and the relative fold changes in Aly/REF and UAP56 siRNA transfected cells are shown. Values are mean ± s.d. of at least 9 cells that were analyzed for each condition. (e) RT-qPCR quantification of M2/M1 mRNA ratio in cells transfected with control siRNA, Aly/REF siRNA, or UAP56 siRNA and infected for 6h. Values are mean of ratios ± s.d. from 3 independent experiments. (f) A549 cells were treated with 100 nM meayamycin or 0.1% DMSO (control) for 2h and infected with WSN at MOI 10 for 1h. Virus was removed and 100 nM meayamycin or 0.1% DMSO was added for 3h. Cells were subjected to RNA-FISH. Nuclear speckles were marked with SON antibody. (g) A549 cells were transfected with control siRNA or Aly/REF siRNA. After 48h, cells were processed as in f. (h) M mRNA intensities at nuclear speckles in cells treated as in g were quantified. M mRNA signal at speckles was normalized to the average speckle volume measured within each cell. Values obtained from cells transfected with Aly/REF siRNA (control)were set to 1 and the relative fold changes in meayamycin treated cells depleted of Aly/REF are shown. Values are mean ± s.d. of at least 9 cells that were analyzed for each condition. Images shown in a,b,f and g are representative of three independent experiments. All insets are enlargement of nuclear speckle areas. All scale bars = 10µm.
Figure 6
Figure 6. Nuclear Speckle Assembly Factor SON Interacts with M1 mRNA and Mediators of M1 mRNA Splicing
(a) VERO cells were transfected with control siRNA, Aly/REF siRNA, or UAP56 siRNA. After 48h, cells were infected with WSN (a) or WSN ΔNS1(b) at MOI 10 for 6h. Cells were then fixed for M mRNA labeling by RNA-FISH. Nuclear speckles were marked with SON antibody. Insets are enlargement of areas showing nuclear speckles. Images shown in a and b are representative of three independent experiments. Scale bar = 10µm. (c) Accumulation of M mRNA at nuclear speckles was quantified and compared between WSN and WSN ΔNS1 infected cells transfected with siRNA as in a and b. Values are mean ± s.d. of at least 11 cells that were analyzed in each treatment. p.i.- post infection. (d) RT-qPCR quantification of M2/M1 mRNA ratio in VERO cells transfected with control siRNA, Aly/REF siRNA, or UAP56 siRNA and infected for 6h with WSN or WSN ΔNS1 at MOI 1. The average M2/M1 mRNA ratio from control siRNA transfected cells infected with WSN (M2/M1 mRNA = 0.495) was set to 1 and the relative average M2/M1 ratio at the depicted conditions are shown. Values are mean ± s.d. from three independent experiments. ** T test p value < 0.01. (e–g) Cell extracts from uninfected or infected A549 cells treated with RNase inhibitor (RNasin) or with RNase A were subjected to immunoprecipitations with antibodies specific to NS1-BP or SON. Immunoprecipitates (Bound) and unbound fractions were subjected to western blot using antibodies specific to the depicted proteins. (h–i) SON binds directly to M1 mRNA. The entire M1 mRNA was radiolabeled uniformly at C residues, incubated with JSL1 nuclear extract under splicing conditions, crosslinked with 254 nm light and digested with RNase. The reaction was then either resolved by SDS-PAGE (25% Total) or incubated in separate reactions with the antibodies indicated (IP: anti-). Total reaction or immunoprecipitated proteins were resolved by SDS-PAGE. (j) Model for influenza virus M1 mRNA trafficking and splicing. Data shown in e–i are representative of three independent experiments.

Comment in

References

    1. Spector DL, Lamond AI. Nuclear speckles. Cold Spring Harbor perspectives in biology. 2011;3 - PMC - PubMed
    1. Mao YS, Zhang B, Spector DL. Biogenesis and function of nuclear bodies. Trends Genet. 2011;27:295–306. - PMC - PubMed
    1. Saitoh N, et al. Proteomic analysis of interchromatin granule clusters. Molecular biology of the cell. 2004;15:3876–3890. - PMC - PubMed
    1. Misteli T, Caceres JF, Spector DL. The dynamics of a pre-mRNA splicing factor in living cells. Nature. 1997;387:523–527. - PubMed
    1. Tilgner H, et al. Deep sequencing of subcellular RNA fractions shows splicing to be predominantly co-transcriptional in the human genome but inefficient for lncRNAs. Genome Res. 2012;22:1616–1625. - PMC - PubMed

Publication types

MeSH terms