. 2016 Oct 28;36(22):2824-2837.
doi: 10.1128/MCB.00194-16. Print 2016 Nov 15.

p66Shc Couples Mechanical Signals to RhoA through Focal Adhesion Kinase-Dependent Recruitment of p115-RhoGEF and GEF-H1

Affiliations

p66Shc Couples Mechanical Signals to RhoA through Focal Adhesion Kinase-Dependent Recruitment of p115-RhoGEF and GEF-H1

Ru-Feng Wu et al. Mol Cell Biol. .

Abstract

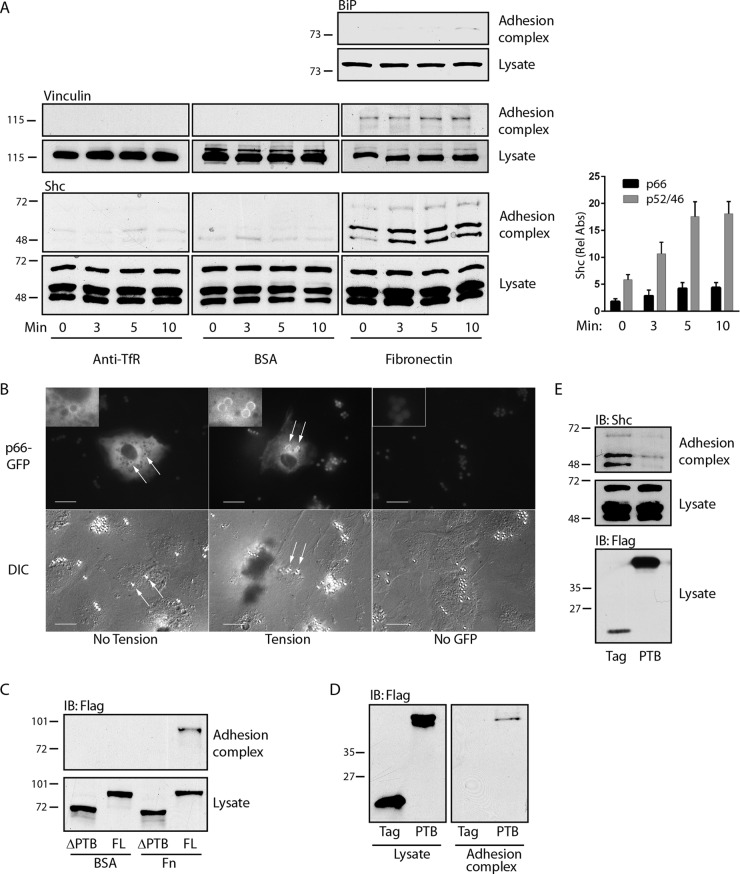
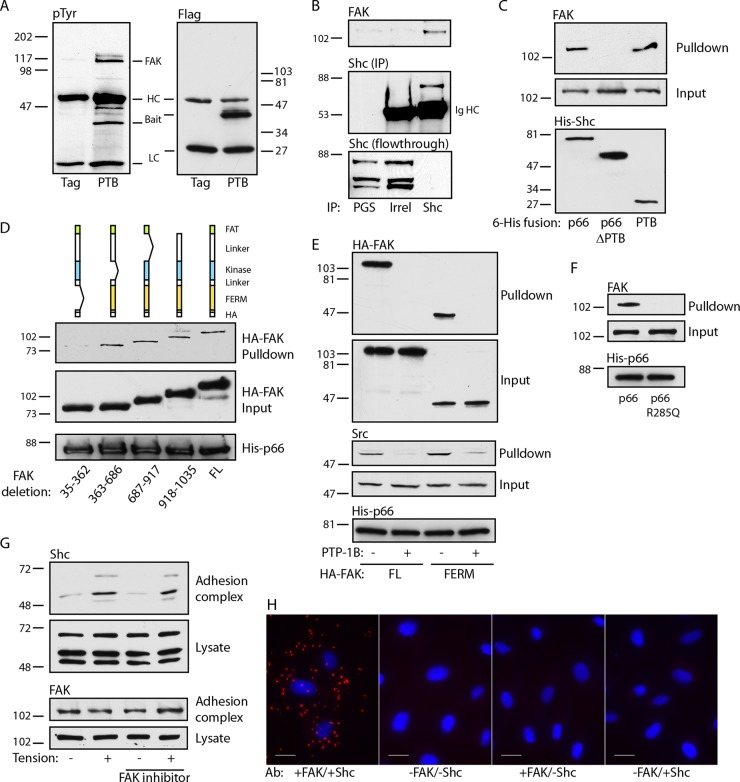
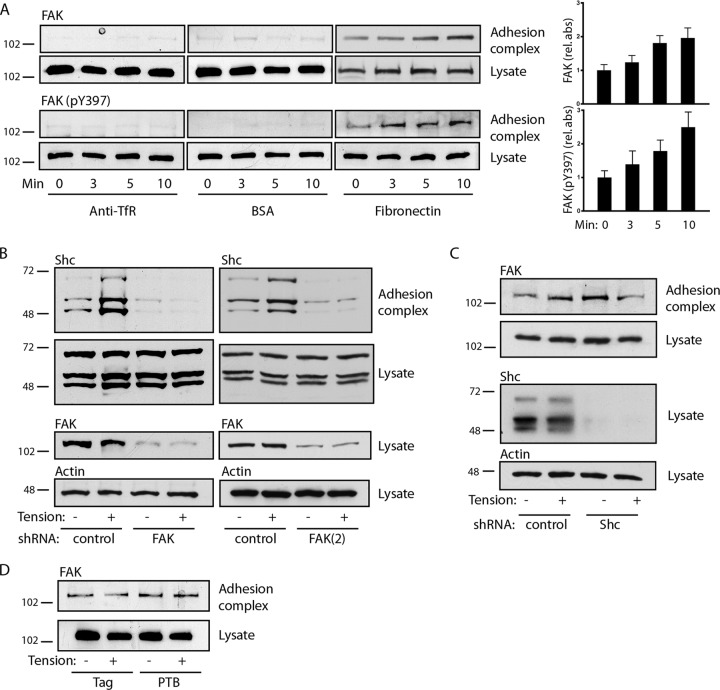
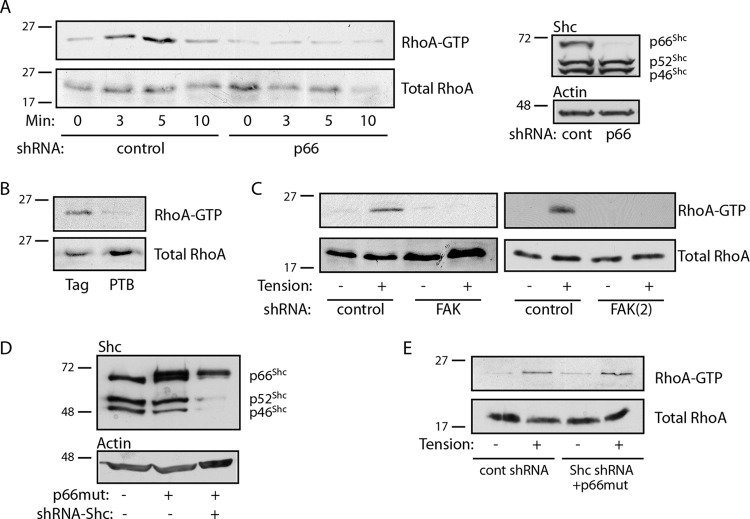
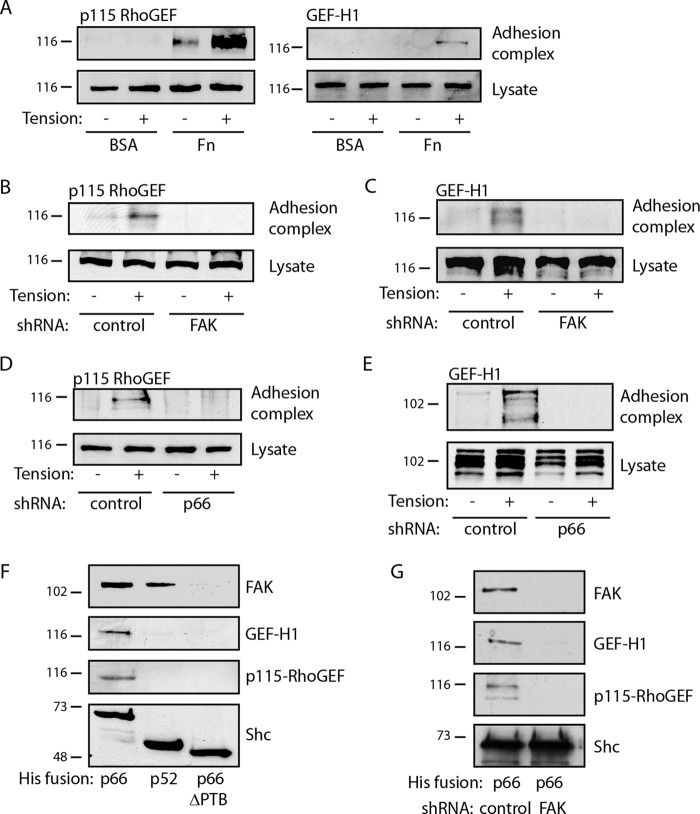
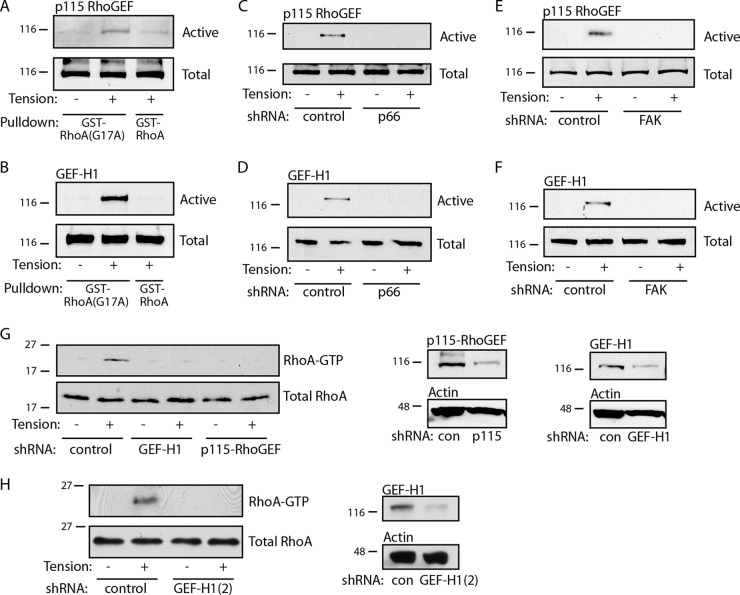
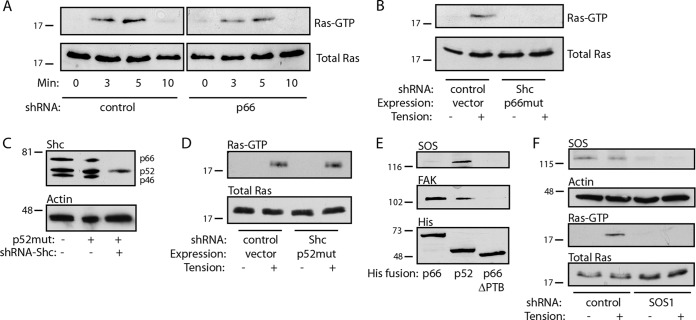
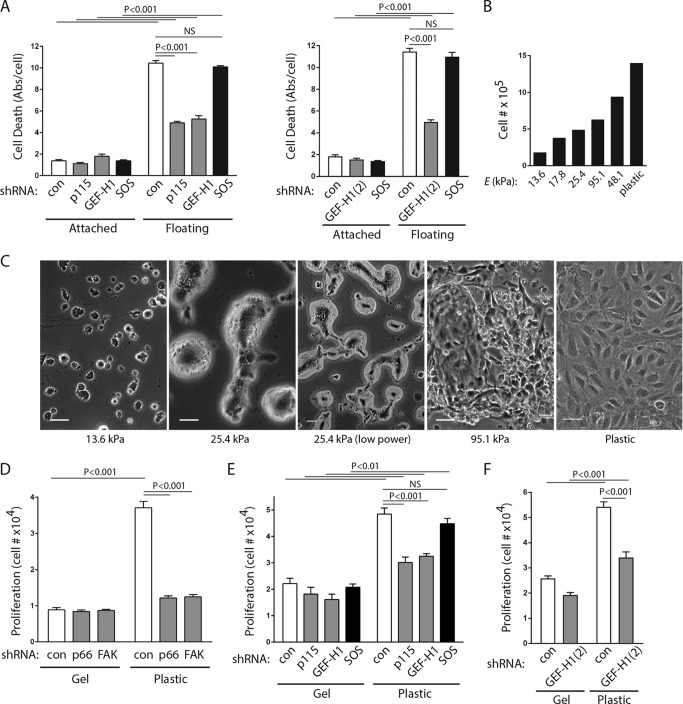
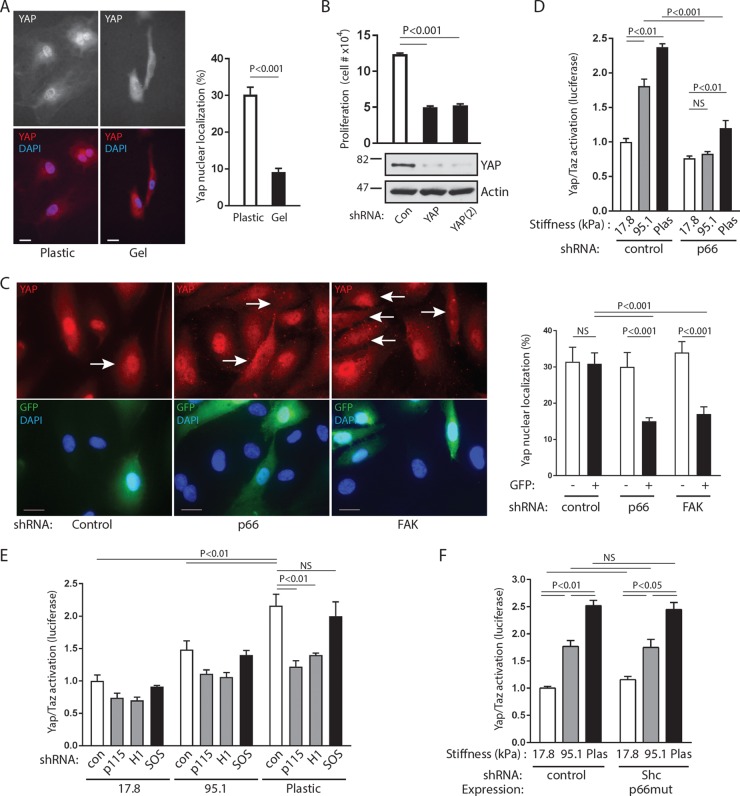
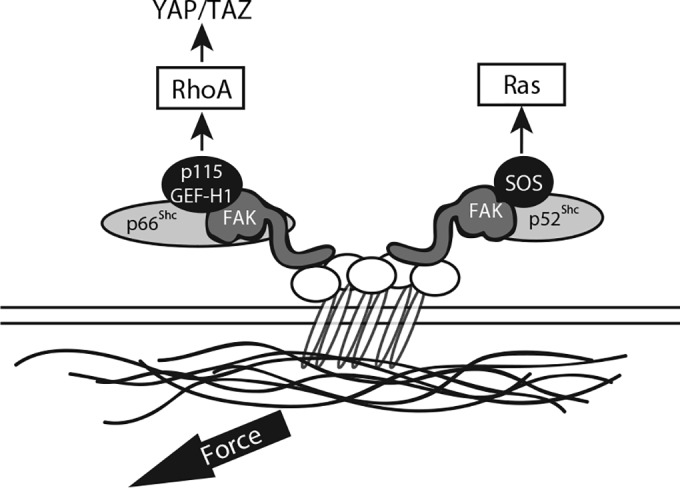
Tissue cells respond to changes in tensional forces with proliferation or death through the control of RhoA. However, the response coupling mechanisms that link force with RhoA activation are poorly understood. We found that tension applied to fibronectin-coated microbeads caused recruitment of all three isoforms of the Shc adapter (p66Shc, p52Shc, and p46Shc) to adhesion complexes. The Shc PTB domain was necessary and sufficient for this recruitment, and screening studies revealed the direct interactions with the FERM domain of focal adhesion kinase (FAK) that were required for Shc translocation to adhesion complexes. The FAK/p66Shc complex specifically bound and activated the Rho guanyl exchange factors (GEFs) p115-RhoGEF and GEF-H1, leading to tension-induced RhoA activation. In contrast, the FAK/p52Shc complex bound SOS1 but not the Rho GEFs to mediate tension-induced Ras activation. Nuclear translocation and activation of the YAP/TAZ transcription factors on firm substrates required the FAK/p66Shc/Rho GEF complex, and both proliferation on firm substrates and anoikis in suspension required signaling through p66Shc and its associated Rho GEFs. These studies reveal the binary and exclusive assignment of p66Shc and p52Shc to tension-induced Rho or Ras signals, respectively, and suggest an integrated role for the two Shc isoforms in coordinating the cellular response to mechanical stimuli.


Figures

FIG 1
FIG 1
Shc is recruited to adhesion complexes through its PTB domain. (A) (Left) Paramagnetic beads covalently bound to antitransferrin receptor antibodies (anti-TfR), BSA, or fibronectin were allowed to settle on HUVECs for 40 min and were then subjected to a magnetic field for the indicated times. After lysis, the beads were recovered and both bead-associated protein complexes (top) and lysates (bottom) were immunoblotted with the indicated antibodies. (Right) The bar graph shows the relative recruitment of Shc isoforms to fibronectin-coated beads (mean ± SEM, n = 6). Rel Abs, relative absorbance. (B) Cells were transfected with p66-GFP and fibronectin-coated beads that were allowed to settle for 40 min (left) and then subjected to a magnetic field for 5 to 10 min (center and right). Fluorescence and differential inference contrast (DIC) images are shown for each field. (C) HUVECs were transduced with Flag-tagged full-length (FL) p66Shc or p66Shc from which the PTB domain was deleted, treated with microbeads coated with either BSA or fibronectin (Fn), and then subjected to a magnetic field for 5 min. Adhesion complexes and lysates were immunoblotted (IB) for Flag. (D) Cells were transduced with Flag or Flag-PTB, treated with fibronectin-bound microbeads, and then exposed to a magnetic field for 5 min. Adhesion complexes and lysates were immunoblotted for Flag. (E) Cells were treated as described in the legend to panel D, and adhesion complexes and lysates were immunoblotted for Shc. The data in panels C to E are representative of those from 3 separate experiments. The numbers to the left of the gels in panels C to E are molecular masses (in kilodaltons).
FIG 2
FIG 2
The Shc PTB domain binds the FAK FERM domain. (A) Cells transduced with either Flag or Flag-PTB were immunoprecipitated with anti-Flag and immunoblotted with antiphosphotyrosine (pTyr) or anti-Flag. HC, Ig heavy chain, LC, Ig light chain. (B) Cell lysates were immunoprecipitated with protein G-Sepharose (PGS), control Ig, or anti-Shc and immunoblotted for FAK and Shc. The bottom panel shows the results obtained with the lysate after immunoprecipitation, showing substantial capture of Shc. The results are representative of those from 3 immunoprecipitation experiments. Shc (IP), Shc in the immunoprecipitate; Irrel, irrelevant antibody. (C) Bacterially expressed His fusions of full-length p66Shc, p66Shc from which the PTB domain was deleted, or the isolated PTB domain were used to pull down endogenous FAK from cell lysates. The relative expression of His-Shc baits is 1:2.1:0.7. The results are representative of those from 2 experiments. (D) (Top) The cartoons depict serial deletions of the HA-tagged FAK transfected into HUVECs. His-tagged p66Shc was used to pull down cell lysates. Input and pulldown fractions for FAK and His-p66 bait are shown. The relative expression of the HA-FAK proteins is 1:1.1:1.1:1.4:1.6. (E) Cells transfected with full-length (FL) or FERM domain-only FAK-HA fusions were pulled down by His-p66. Pretreatment of lysates with PTP-1B is marked. Input and pulldown fractions were blotted for HA and Src. (F) Lysates of untransfected cells were used for pulldown by His-tagged wild-type p66 or p66 R285Q. Input and pulldown fractions for endogenous FAK are shown. (G) Fibronectin-coated beads were added to untreated or FAK inhibitor 14-treated (1 μM for 30 min) cells, and tension was applied. Adhesion complex and lysate fractions were blotted for Shc and FAK. The results in panels E to G are representative of those from 2 experiments. The numbers to the left and right of the gels in panels A to G are molecular masses (in kilodaltons). (H) HUVECs were plated on fibronectin, and PLA was performed. Primary antibodies (Ab) for FAK and Shc, Shc only, or FAK only were omitted for 3 negative controls, as shown. Bars, 20 μm.
FIG 3
FIG 3
FAK recruits Shc to adhesion complexes. (A) (Left) Microbeads coupled to anti-transferrin receptor antibodies, BSA, or fibronectin were allowed to settle on cells for 40 min, and a magnetic field was applied for the indicated times. Adhesion complexes and lysates were immunoblotted for FAK and FAK (pY397). (Right) The bar graphs show the means ± SEMs from 6 (for FAK) or 5 [for FAK (pY397)] determinations. P was <0.05 at 5 min (FAK) and 10 min [FAK and FAK (pY397)]. (B) Cells were transduced with control or two different FAK shRNAs [FAK and FAK(2)], and fibronectin-coated microbeads were subjected to magnetic tension for 5 min and assessed for recruitment of Shc to adhesion complexes. FAK was knocked down ∼92% [FAK] and ∼70% [FAK(2)]. (C) Cells were transduced with control or Shc shRNA and treated as described in the legend to panel B to assess the recruitment of FAK to adhesion complexes. Shc was knocked down ∼93%. (D) Cells were transduced with either the empty Flag construct or Flag-PTB and assessed for FAK recruitment to adhesion complexes. The results in panels B to D are representative of those from 2 to 4 experiments. The numbers to the left of the gels are molecular masses (in kilodaltons).
FIG 4
FIG 4
p66Shc mediates RhoA activation. (A) (Left) Cells expressing control (cont) or p66Shc shRNA were exposed to fibronectin-coated beads, and magnetic force was applied for the indicated times. RhoA activity is shown. (Right) Specificity of p66Shc knockdown on Shc expression. The p66Shc knockdown efficiency was ∼93%. (B) Cells transduced with Flag alone or Flag-PTB were exposed to fibronectin-coated beads, magnetic force was applied for 5 min, and then RhoA activity was assessed. (C) Cells expressing control or two different FAK shRNAs [FAK and FAK(2)] were exposed to fibronectin-coated beads, magnetic force was applied for 5 min, and then RhoA activity was assessed. FAK knockdown efficiencies were ∼70 to 90%. (D) Cells were transduced with an RNAi-resistant Flag-p66Shc (p66 mutant [p66mut]) and/or shRNA targeting all Shc isoforms. (E) The effect of p52Shc/p46Shc knockdown on RhoA activation is shown. Magnetic force was applied for 5 min, as in the assays whose results are presented in panels A to D. The results in panels A to E are representative of those from 2 or 3 separate experiments. The numbers to the left of the gels are molecular masses (in kilodaltons).
FIG 5
FIG 5
p66Shc cooperates with FAK to recruit Rho GEFs. (A) HUVECs were exposed to microbeads bound to either BSA or fibronectin (Fn), and a magnetic field was applied for 5 min. The recruitment of p115-RhoGEF and GEF-H1 to adhesion complexes is shown. (B to E) Cells were transduced with control shRNA or shRNA directed against FAK (B, C) or p66Shc (D, E). Magnetic force was applied to fibronectin-bound microbeads for 5 min, and adhesion complexes were isolated to assess recruitment of p115-RhoGEF (B, D) or GEF-H1 (C, E). (F) Solid-phase His fusions of full-length p66Shc, p52Shc, or p66Shc from which PTB was deleted were used to pull down cell lysates. The captured proteins are indicated. (G) His-p66Shc was used to pull down lysates in cells transduced with control or FAK shRNA. The results in panels A to G are representative of those from 2 to 4 separate experiments. The numbers to the left of the gels are molecular masses (in kilodaltons).
FIG 6
FIG 6
Tension activates Rho GEFs through p66Shc and FAK. For the assays who results are presented in panels A to G, cells were exposed to fibronectin-coated microbeads and a magnetic field was applied for 5 min. (A, B) Total cellular GEF activity of p115-RhoGEF (A) and GEF-H1 (B) obtained by pulldown with RhoA(G17A) is shown. GST-RhoA (wild type) was included as a negative control. (C to F) GEF activity for p115-RhoGEF (C, E) and GEF-H1 (D, F) is shown following knockdown of p66Shc (C, D) or FAK (E, F). (G) (Left) RhoA activation in response to tension is shown in cells transduced with control (con), GEF-H1, or p115-RhoGEF shRNA. (Center and right) Protein levels after knockdown. The knockdown efficiency was ∼69% (GEF-H1) and 92% (p115). (H) Cells were transduced with separate shRNA for GEF-H1, and RhoA activity was assessed. The knockdown efficiency was ∼79% [GEF-H1(2)]. The results in panels A to H are representative of those from 2 to 4 separate experiments. The numbers to the left of the gels are molecular masses (in kilodaltons).
FIG 7
FIG 7
p52Shc cooperates with FAK to recruit SOS. (A) Cells transduced with control or p66Shc shRNA were exposed to fibronectin-coated microbeads, and a magnetic field was applied for the indicated times. Ras activity is shown. (B) Cells expressing RNAi-resistant Flag-p66Shc (p66 mutant [p66mut]) and/or shRNA targeting all Shc isoforms were subjected to magnetic tension, as described in the legend to panel A. Ras activity is shown. (C) Cells were transduced with RNAi-resistant p52Shc (p52 mutant [p52mut]) and/or global Shc shRNA. (D) Cells expressing the p52 mutant with Shc shRNA or controls were subjected to magnetic tension, and Ras activity was assessed. (E) 6×His fusions of full-length p66Shc, p66Shc from which PTB was deleted, or p52Shc were used to pull down lysates, and the recovered proteins are indicated. (F) The effect of SOS1 knockdown on tension-induced Ras activation is shown. SOS1 knockdown efficiency was ∼89%. The results in panels A to F are representative of those from 2 to 4 separate experiments. The numbers to the left of the gels are molecular masses (in kilodaltons).
FIG 8
FIG 8
p115-RhoGEF and GEF-H1 mediate anchorage signals. (A) HUVECs were transduced with the indicated shRNAs, and cell death was measured after 16 h of adhesion or floating conditions. Significant differences between conditions are shown at the top of the bar graphs. Means ± SEMs from 4 determinations are shown. Knockdown efficiencies for all GEFs were between 70 and 87%. Abs/cell, absorbance per cell. (B) Cell counts after 48 h on hydrogels of the indicated stiffness (Young's modulus [E]), showing a progressive effect on proliferation. (C) Phase-contrast images of HUVECs plated on collagen-coated hydrogels showing the morphological response to changes in matrix bed stiffness. Bars, 50 μm. (D) Cells expressing shRNA against the control (con), p66Shc, or FAK were plated on hydrogels (approximately 17.8 kPa) or plastic, each of which was bound to collagen, and cell counts were determined after 48 h. (E, F) Cell counts under the conditions described in the legend to panel D, except that cells were transduced with shRNA against the control, p115-RhoGEF, GEF-H1, or SOS1. Significant differences are shown above the bar graphs. The results in panels D to F are means ± SEMs from 4 determinations. Knockdown efficiencies were between 70 and 90% for all GEFs. NS, not significant.
FIG 9
FIG 9
p66Shc acts upstream of YAP/TAZ transactivation. (A) (Left) HUVECs were plated on either plastic or hydrogels (∼17.8 kPa) and immunostained for endogenous YAP. Bars, 20 μm. (Right) The proportion of nuclear YAP to total cellular YAP (mean ± SEM for 30 cells) was quantified. (B) (Top) Cells were transduced with either control shRNA (Con) or two different shRNAs against YAP [YAP and YAP(2)] and plated on plastic at equal densities. Cell counts were performed 48 h later (data are means ± SEMs from 4 experiments). (Bottom) Efficiency of knockdown [YAP, ∼85%; YAP(2), ∼90%]. (C) (Left) HUVECs were transduced with shRNA as indicated and stained for YAP (red, top) and DAPI (blue, bottom). GFP expression (green, bottom) marks lentivirus-transduced cells expressing shRNAs. Arrows, GFP-expressing cells. Bars, 20 μm. (Right) YAP nuclear signal intensity of GFP-negative and GFP-positive cells, following transduction with shRNAs against the control, p66Shc, or FAK. Data are means ± SEMs for 18 to 27 cells. (D) YAP/TAZ transactivation was measured by use of a luciferase reporter in cells expressing control or p66Shc shRNA plated on plastic or hydrogels of the indicated elastic moduli. Data are means ± SEMs from 4 determinations. (E) YAP/TAZ transactivation in cells expressing the indicated shRNAs and plated on plastic or hydrogels of the indicated elastic moduli. Data are means ± SEMs from 3 determinations. (F) YAP/TAZ activation of cells expressing control shRNA or pan-Shc shRNA plus RNAi-resistant p66Shc (p66 mutant [p66mut]) plated on soft gels or plastic. Data are means ± SEMs from 3 to 6 determinations. Significant differences are shown above the bar graphs. NS, not significant. Knockdown efficiencies for p66, p52, and FAK were >90%, and those for GEFs were 70 to 90%.
FIG 10
FIG 10
Proposed signaling pathways. The schematic shows the bifurcation of RhoA and Ras activation in response to tension. p66Shc and p52Shc each associate with FAK but recruit distinct GEFs to transduce mechanical signals to RhoA or Ras, respectively.

Similar articles

Cited by

References

    1. Matthews BD, Overby DR, Mannix R, Ingber DE. 2006. Cellular adaptation to mechanical stress: role of integrins, Rho, cytoskeletal tension and mechanosensitive ion channels. J Cell Sci 119:508–518. doi:10.1242/jcs.02760. - DOI - PubMed
    1. McBeath R, Pirone DM, Nelson CM, Bhadriraju K, Chen CS. 2004. Cell shape, cytoskeletal tension, and RhoA regulate stem cell lineage commitment. Dev Cell 6:483–495. doi:10.1016/S1534-5807(04)00075-9. - DOI - PubMed
    1. Ewald AJ, Brenot A, Duong M, Chan BS, Werb Z. 2008. Collective epithelial migration and cell rearrangements drive mammary branching morphogenesis. Dev Cell 14:570–581. doi:10.1016/j.devcel.2008.03.003. - DOI - PMC - PubMed
    1. Farge E. 2003. Mechanical induction of Twist in the Drosophila foregut/stomodeal primordium. Curr Biol 13:1365–1377. doi:10.1016/S0960-9822(03)00576-1. - DOI - PubMed
    1. Harden N, Ricos M, Ong YM, Chia W, Lim L. 1999. Participation of small GTPases in dorsal closure of the Drosophila embryo: distinct roles for Rho subfamily proteins in epithelial morphogenesis. J Cell Sci 112(Pt 3):273–284. - PubMed

LinkOut - more resources