. 2016 Oct 7;291(41):21786-21801.
doi: 10.1074/jbc.M116.730911. Epub 2016 Aug 29.

Regulation of Human Endonuclease V Activity and Relocalization to Cytoplasmic Stress Granules

Affiliations

Regulation of Human Endonuclease V Activity and Relocalization to Cytoplasmic Stress Granules

Meh Sameen Nawaz et al. J Biol Chem. .

Abstract

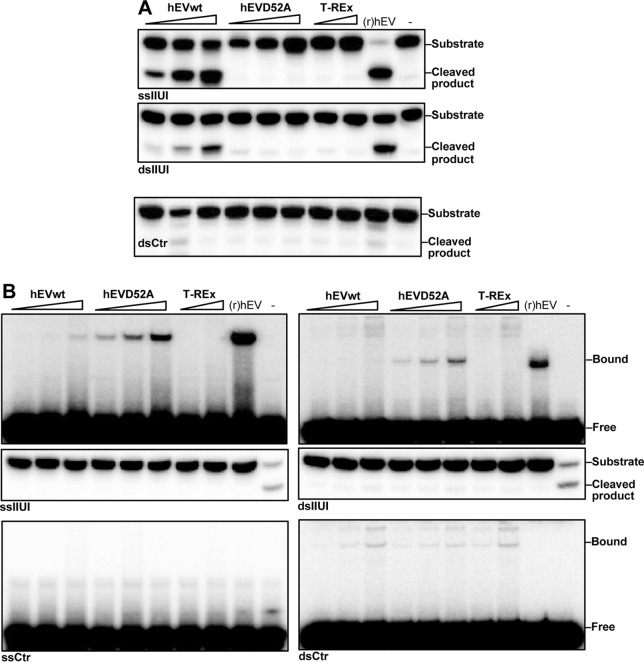
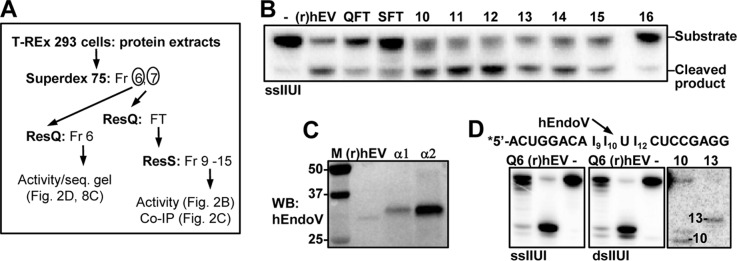
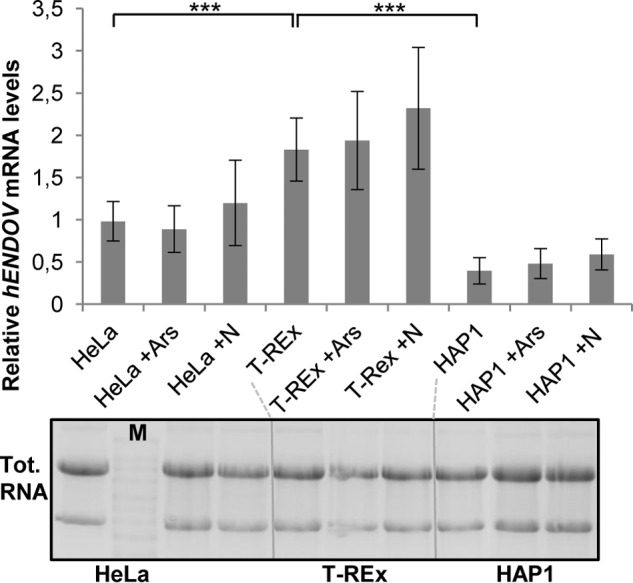
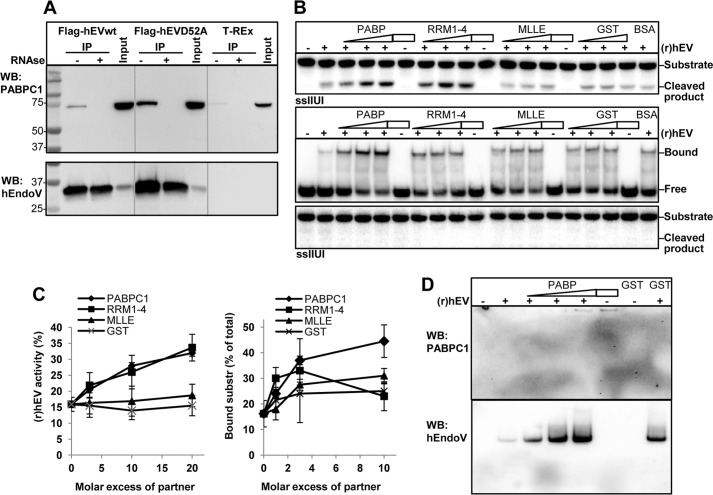
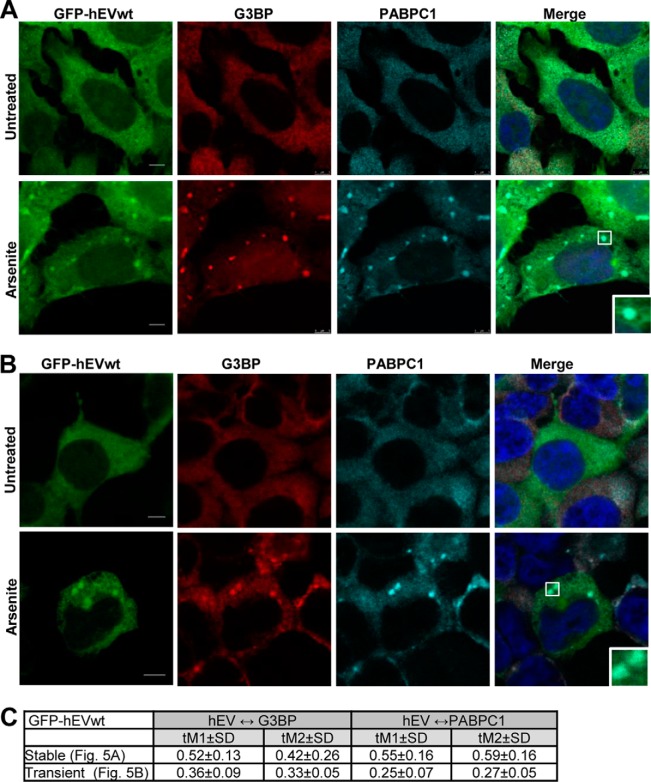
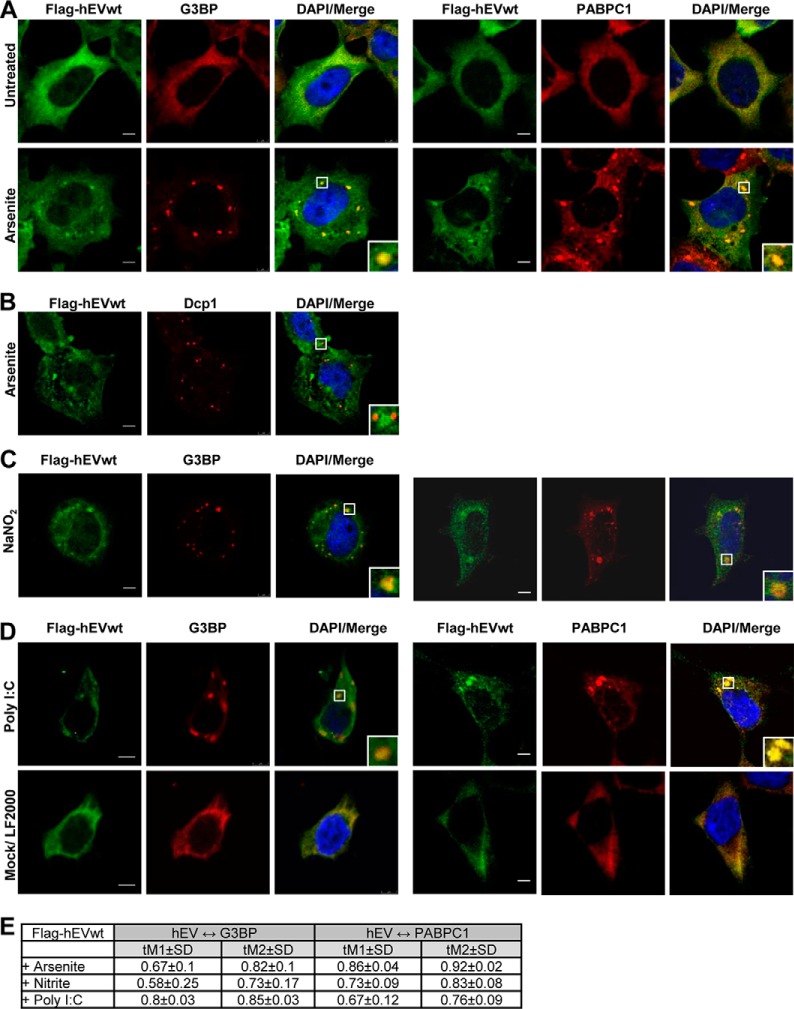
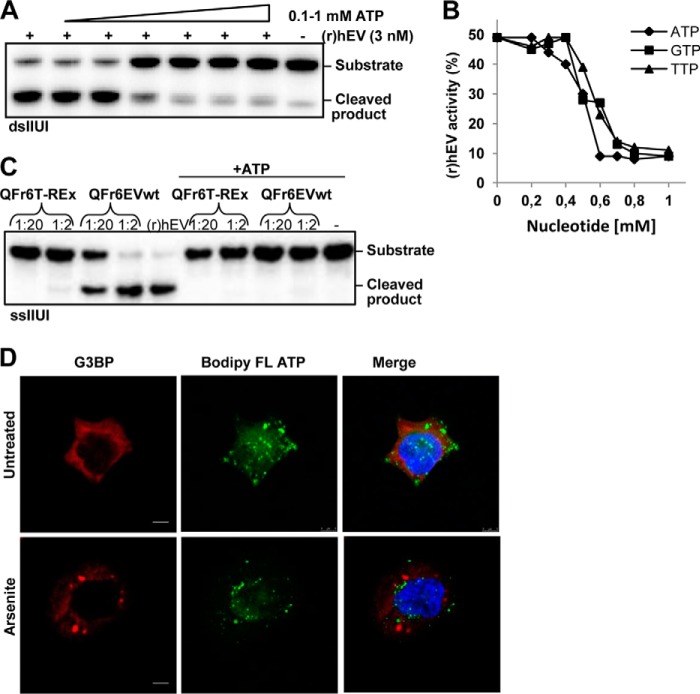
Endonuclease V (EndoV) is an enzyme with specificity for inosines in nucleic acids. Whereas the bacterial homologs are active on both DNA and RNA, the mammalian variants only cleave RNA, at least when assayed with recombinant proteins. Here we show that ectopically expressed, as well as endogenously expressed human (h)EndoV, share the same enzymatic properties as the recombinant protein and cleaves RNA with inosine but not DNA. In search for proteins interacting with hEndoV, polyadenylate-binding protein C1 (PABPC1) was identified. The association between PABPC1 and hEndoV is RNA dependent and furthermore, PABPC1 stimulates hEndoV activity and affinity for inosine-containing RNA. Upon cellular stress, PABPC1 relocates to cytoplasmic stress granules that are multimolecular aggregates of stalled translation initiation complexes formed to aid cell recovery. Arsenite, as well as other agents, triggered relocalization also of hEndoV to cytoplasmic stress granules. As inosines in RNA are highly abundant, hEndoV activity is likely regulated in cells to avoid aberrant cleavage of inosine-containing transcripts. Indeed, we find that hEndoV cleavage is inhibited by normal intracellular ATP concentrations. The ATP stores inside a cell do not overlay stress granules and we suggest that hEndoV is redistributed to stress granules as a strategy to create a local environment low in ATP to permit hEndoV activity.

Keywords: ATP; PABPC1; RNA; RNA processing; deamination; endonuclease V; inosine; nitrosative stress; ribonuclease; stress granule.


Figures

FIGURE 1.
FIGURE 1.
Activity and affinity for inosine-containing RNA for ectopically expressed FLAG-hEndoV. A, FLAG-hEndoVwt (hEVwt) and mutant D52A (hEVD52A) were overexpressed in T-REx 293 cells, protein extracts were prepared and assayed for activity toward ss- and dsRNA substrates containing multiple inosines (IIUI). Protein extract was also made from cells without any overexpression (T-REx). Increasing amounts of extracts were tested (10–30-100 and 30–100 ng for the T-REx extract) and recombinant (r)hEndoV ((r)hEV) (30 nm) was included as a positive control. An RNA substrate without inosine (dsCtr) was also tested. Cleavage products were analyzed on a 20% denaturing polyacrylamide gel. B, single- and double-stranded IIUI substrates (upper panels) as well as control RNA oligonucleotides (ss/dsCtr; lower panels) were incubated with FLAG-hEndoVwt and FLAG-hEndoV(D52A) protein extracts (1–2-4 μg; 2–4 μg for the T-REx extract) on ice. Recombinant (r)hEndoV (150 nm) was included as a positive control. Free and bound fractions were separated on native 10% polyacrylamide gels. −, no enzyme added. Middle panels: a fraction of the EMSA reactions with ss/dsIIUI were analyzed for cleavage by 20% denaturing PAGE as in A. (r)hEndoV assayed under condition for activity are positive controls for cleavage (most to the right).
FIGURE 2.
FIGURE 2.
Activity of endogenously expressed hEndoV. A, purification scheme for endogenously expressed hEndoV using T-REx 293 cells as starting material. ResQ, Resource Q; ResS, Resource S chromatography; Fr, fraction; FT, flow-through. B, flow-through (QFT and SFT) and partly purified fractions (fraction 10–16) after ResS chromatography were probed for inosine-RNA (ssIIUI) cleavage activity. 1 μl from each fraction was used in the assays and recombinant (r)hEndoV (30 nm) as positive control. C, immunoprecipitation followed by Western blot analysis of endogenous hEndoV. Fractions 10 and 11 after ResS were diluted in IP buffer and supplemented with 2 μg of polyclonal (α1) or monoclonal (α2) hEndoV antibody. Precipitated material was run on SDS-PAGE, the gel was blotted onto a nylon membrane and proteins were detected with a third hEndoV antibody (polyclonal; α3). Recombinant hEndoV ((r)hEV, 20 ng) was included as a positive control in the Western blot (WB) analysis. Molecular mass marker (M) with sizes (in kDa) is shown to the left. D, cleavage products for endogenous hEndoV (Q6, ResQ Fr 6 T-REx) on single- and double-stranded IIUI substrates were run on 20% sequencing gels alongside with recombinant (r)hEV. Markers were RNA oligonucleotides of 10 and 13 residues. The sequence of the IIUI substrate and the preferred cleavage position for hEndoV is shown above the gel picture.
FIGURE 3.
FIGURE 3.
Expression of hENDOV mRNA. Human ENDOV transcript levels were measured by qRT-PCR in HeLa, T-REx 293, and HAP1 cells treated with or without arsenite (Ars) or nitrite (N). Values relative to GAPDH were calculated and the results presented are the average of 6 qRT-PCRs using cDNA from three independent experiments. Error bars represent standard deviations and statistical significance was determined by Student's t test; ***, p < 0.002. Total RNA used as starting material for cDNA synthesis was analyzed by denaturing agarose gel electrophoresis (samples loaded in the same order as shown for the qRT-PCR). Marker (M) is the Millenium RNA marker (Ambion).
FIGURE 4.
FIGURE 4.
Interaction between hEndoV and PABPC1. A, protein extracts were made from T-REx 293 cells expressing FLAG-hEndoVwt and FLAG-hEndoV(D52A). FLAG-hEndoVwt and D52A were isolated using anti-FLAG beads and co-precipitated material was separated by SDS-PAGE. Extract without hEndoV overexpression (T-REx) was used as control for unspecific binding to the beads and input represents the starting material (1.5 mg). Addition of RNase to the samples is indicated (−/+). After blotting, the membrane was probed with a PABPC1 antibody (upper panel). The membrane was stripped and reprobed with a hEndoV antibody (polyclonal; in house)(lower panel). Gray lines are drawn to separate the three extracts. B, upper panel, (r)hEndoV (0.2 nm) was incubated with the single-stranded IIUI substrate and increasing amounts of PABPC1, RRM1–4, MLLE, GST (0.6–1.8–3.6 nm), or BSA (3.6 nm) and activity was measured by denaturing PAGE. Samples without (r)hEndoV (−) contained protein (3.6 nm) as indicated. Middle panel, (r)hEndoV (70 nm) was incubated with the single-stranded IIUI substrate and increasing amounts of the same proteins as above (70–200-700 nm) or a fixed amount of BSA (700 nm) and a band shift assay was performed. Samples without (r)hEndoV (−) contained protein (700 nm) as indicated. Lower panel: a fraction of the EMSA reactions was analyzed for cleavage by 20% denaturing PAGE. C, cleavage and band shift in B was quantified in two-three separate experiments with two parallels in each. Error bars indicate S.D. D, yet another fraction of the EMSA reactions was run on a separate native EMSA gel, blotted onto a nylon membrane, and subjected to Western analysis. The membrane was probed first with PABPC1 antibody (upper panel) prior to hEndoV antibody (polyclonal, in house).
FIGURE 5.
FIGURE 5.
hEndoV and PABPC1 colocalize in cytoplasmic stress granules. A, T-REx 293 cells stably transfected and B, HEK 293T cells transiently transfected with GFP-hEndoVwt were left untreated or exposed to arsenite (0.5 mm, 30 min), fixed, and processed for confocal microscopy. Cells were stained with PABPC1 (cyan) or G3BP (red) antibodies and DAPI (blue) to visualize the nuclei. GFP-hEndoV is shown in green. Localization of proteins was observed by confocal microscopy (Leica SP8) using a ×40 oil objective. Bar, 5 μm. Representative images are shown. C, the Manders' coefficients for colocalization (tM1 and tM2 ± S.D.) were determined for cells stably or transiently expressing GFP-hEndoVwt. tM1 ± S.D. expresses the degree of colocalization of the green channel (GFP-hEndoV) with the red/cyan channel (G3BP/PABPC1). tM2 ± S.D. expresses the degree of colocalization of the red/cyan channel with the green channel.
FIGURE 6.
FIGURE 6.
Induction of hEndoV-containing stress granules by various stress. A, T-REx 293 cells ectopically expressing FLAG-hEndoVwt were cultured in the absence or presence of arsenite (0.5 mm, 30 min) before processing for visualization of hEndoV (green) and G3BP (red) (left panels) or hEndoV (green) and PABPC1 (red) (right panels) or (B) hEndoV (green) and Dcp1 (red). C, T-REx 293 FLAG-EndoVwt cells were cultured in the presence of nitrite (200 mm, 1 h) or D, transiently transfected with poly(I:C) (500 ng, 7 h) and processed for imaging of hEndoV (green) and G3BP/PABPC1 (red). Mock-treated cells were also included. Nuclei were counterstained using DAPI (blue) and colocalization (yellow) is shown in Merge. Localization of proteins was observed by confocal microscopy (Leica SP8) using a ×40 oil objective. Bar, 5 μm. E, Manders' coefficients for colocalization of hEndoV and G3BP (left columns) or hEndoV and PABPC1 (right columns).
FIGURE 7.
FIGURE 7.
Stress granule assembly is independent of hEndoV activity. A, T-REx 293 cells ectopically expressing FLAG-hEndoV(D52A) were cultured in the absence or presence of arsenite (0.5 mm, 30 min) before processing for visualization of hEndoV (green) and G3BP (red). Nuclei were counterstained using DAPI (blue) and colocalization (yellow) is shown in Merge. Localization of proteins was observed by confocal microscopy (Leica SP8) using a ×40 oil objective. Bar, 5 μm. B, Manders' coefficients for colocalization of FLAG-hEndoV(D52A) and G3BP and C, the average number and size of stress granules per cell in A. Error bars represent the S.D. calculated from 20 randomly selected cells in each cell type. Stress granules were defined as G3BP foci measuring >0.1 μm. Representative images are shown. D, stress granules were induced in HAP1wt and ENDOV cells and analyzed as above (E).
FIGURE 8.
FIGURE 8.
ADAR1 and Tudor-SN colocalize with hEndoV in stress granules. T-REx 293 cells ectopically expressing FLAG-hEndoV were cultured in the presence or absence of arsenite (0.5 mm, 30 min). Subsequently, cells were fixed and immunofluoroscence experiments were performed using hEndoV (green) and (A) ADAR1 (red) or (B) Tudor-SN (red) antibodies. DRAQ5 (blue) was used to counterstain nuclei, and colocalization (yellow) is shown in Merge. Localization of proteins was observed by confocal microscopy (Zeiss) using a ×63 oil objective.
FIGURE 9.
FIGURE 9.
ATP inhibits hEndoV activity. A, recombinant hEndoV (3 nm) was incubated with increasing amounts of ATP (0.1–1 mm) and activity toward the double-stranded IIUI substrate was analyzed. Reaction products were separated by denaturing PAGE. B, recombinant hEndoV (2 nm) was incubated with nucleotides as indicated, activity was analyzed as in A and cleavage was quantified. C, partly purified endogenous hEndoV (QFr6T-REx) and overexpressed FLAG-hEndoV (QFr6EVwt) after Resource Q chromatography were diluted as indicated and assayed for activity toward single-stranded IIUI with or without ATP (1 mm). Dilution factors are indicated. −, no enzyme added. D, T-REx 293 cells were incubated with BODIPY FL ATP (20 μm, 3 h), treated with arsenite (0.5 mm, 30 min), and prepared for confocal microscopy. Cells were stained with G3BP (red) antibody for stress granules and DAPI (blue) for visualization of the nuclei. BODIPY FL ATP is green. The merge images are an overlay of all three stains. Confocal images are acquired by a ×40 oil objective (Leica SP8). Bar, 5 μm.

Similar articles

Cited by

References

    1. Lindahl T. (1993) Instability and decay of the primary structure of DNA. Nature 362, 709–715 - PubMed
    1. Prestwich E. G., Mangerich A., Pang B., McFaline J. L., Lonkar P., Sullivan M. R., Trudel L. J., Taghizedeh K., and Dedon P. C. (2013) Increased levels of inosine in a mouse model of inflammation. Chem. Res. Toxicol. 26, 538–546 - PMC - PubMed
    1. Pang B., McFaline J. L., Burgis N. E., Dong M., Taghizadeh K., Sullivan M. R., Elmquist C. E., Cunningham R. P., and Dedon P. C. (2012) Defects in purine nucleotide metabolism lead to substantial incorporation of xanthine and hypoxanthine into DNA and RNA. Proc. Natl. Acad. Sci. U.S.A. 109, 2319–2324 - PMC - PubMed
    1. Yasui M., Suenaga E., Koyama N., Masutani C., Hanaoka F., Gruz P.,Shibutani S., Nohmi T., Hayashi M., and Honma M. (2008) Miscoding properties of 2′-deoxyinosine, a nitric oxide-derived DNA adduct, during translesion synthesis catalyzed by human DNA polymerases. J. Mol. Biol. 377, 1015–1023 - PubMed
    1. Alseth I., Dalhus B., and Bjørås M. (2014) Inosine in DNA and RNA. Curr. Opin. Genet. Dev. 26, 116–123 - PubMed

MeSH terms