. 2016 Oct 7;291(41):21682-21693.
doi: 10.1074/jbc.M116.750968. Epub 2016 Aug 29.

Lys-63-linked Ubiquitination of γ-Aminobutyric Acid (GABA), Type B1, at Multiple Sites by the E3 Ligase Mind Bomb-2 Targets GABAB Receptors to Lysosomal Degradation

Affiliations

Lys-63-linked Ubiquitination of γ-Aminobutyric Acid (GABA), Type B1, at Multiple Sites by the E3 Ligase Mind Bomb-2 Targets GABAB Receptors to Lysosomal Degradation

Khaled Zemoura et al. J Biol Chem. .

Abstract

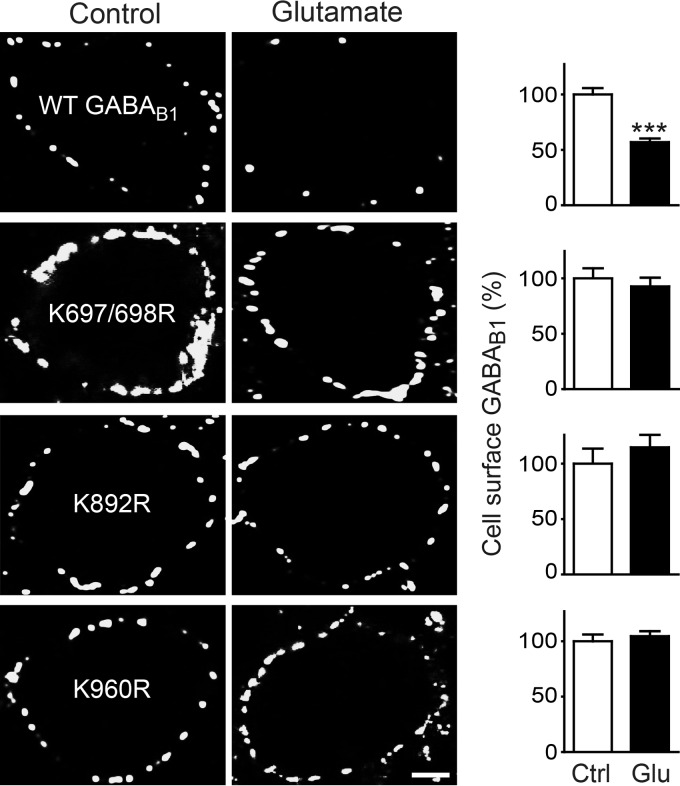
GABAB receptors are heterodimeric G protein-coupled receptors, which control neuronal excitability by mediating prolonged inhibition. The magnitude of GABAB receptor-mediated inhibition essentially depends on the amount of receptors in the plasma membrane. However, the factors regulating cell surface expression of GABAB receptors are poorly characterized. Cell surface GABAB receptors are constitutively internalized and either recycled to the plasma membrane or degraded in lysosomes. The signal that sorts GABAB receptors to lysosomes is currently unknown. Here we show that Mind bomb-2 (MIB2)-mediated Lys-63-linked ubiquitination of the GABAB1 subunit at multiple sites is the lysosomal sorting signal for GABAB receptors. We found that inhibition of lysosomal activity in cultured rat cortical neurons increased the fraction of Lys-63-linked ubiquitinated GABAB receptors and enhanced the expression of total as well as cell surface GABAB receptors. Mutational inactivation of four putative ubiquitination sites in the GABAB1 subunit significantly diminished Lys-63-linked ubiquitination of GABAB receptors and prevented their lysosomal degradation. We identified MIB2 as the E3 ligase triggering Lys-63-linked ubiquitination and lysosomal degradation of GABAB receptors. Finally, we show that sustained activation of glutamate receptors, a condition occurring in brain ischemia that down-regulates GABAB receptors, considerably increased the expression of MIB2 and Lys-63-linked ubiquitination of GABAB receptors. Interfering with Lys-63-linked ubiquitination by overexpressing ubiquitin mutants or GABAB1 mutants deficient in Lys-63-linked ubiquitination prevented glutamate-induced down-regulation of the receptors. These findings indicate that Lys-63-linked ubiquitination of GABAB1 at multiple sites by MIB2 controls sorting of GABAB receptors to lysosomes for degradation under physiological and pathological conditions.

Keywords: E3 ubiquitin ligase; GABA receptor; lysosome; protein degradation; ubiquitylation (ubiquitination).


Figures

FIGURE 1.
FIGURE 1.
Expression level of GABAB receptors is controlled by lysosomes. A, total expression level of GABAB receptors is increased in neurons after blocking lysosomal activity. Cortical neurons were incubated for 12 h with 100 μm leupeptin (Leup) followed by immunostaining for total GABAB1 and GABAB2 as well as for actin using the in-cell Western technique. Neurons not treated with leupeptin served as controls (Ctrl). Right, representative images of an in-cell Western blot. Left, graph shows the quantification of fluorescence intensities normalized to the corresponding actin signals. Fluorescence intensities for GABAB1 and GABAB2 in control neurons were set to 100%. The data represent the mean ± S.E. of 30 cultures from three independent experiments. ***, p < 0.0001; two-tailed unpaired t test. B, expression of cell surface GABAB receptors is increased in neurons after inhibiting lysosomal activity. Cortical neurons were treated as indicated in A and immunostained for cell surface GABAB1 and GABAB2. Left, representative images of the soma of stained neurons. Scale bar, 5 μm. Right, graphs show the quantification of fluorescence intensities. Fluorescence intensities for GABAB1 and GABAB2 in control neurons were set to 100%. The data represent the mean ± S.E. of 30–40 neurons from three independent experiments. ***, p < 0.0001; two-tailed unpaired t test.
FIGURE 2.
FIGURE 2.
Expression level of GABAB receptors is regulated by Lys-63-linked ubiquitination. A, interference with Lys-63-linked ubiquitination increased the expression level of cell surface GABAB receptors. Neurons were transfected with wild-type ubiquitin (Ub) or a ubiquitin mutant unable to form Lys-63-linked chains (Ub(K63R)) and analyzed for GABAB receptor expression using GABAB1 as well as GABAB2 antibodies. Left, representative images of stained neuronal somata (scale bar, 5 μm). Right, quantification of fluorescence intensities. The fluorescence signal of neurons transfected with wild-type ubiquitin was set to 100%. The data represent the mean ± S.E. of 30–34 neurons from three (GABAB1) and two (GABAB2) independent experiments. **, p < 0.004; ***, p < 0.0001; two-tailed unpaired t test. B, inhibition of lysosomal activity enhanced Lys-63-linked ubiquitination of GABAB receptors. Cortical neurons were incubated for 12 h with or without (control) 100 μm leupeptin (Leup) and analyzed for Lys-63-linked ubiquitination by in situ PLA using antibodies directed against GABAB1 and Lys-63-linked ubiquitin (white dots in representative images, scale bar, 5 μm). Right, quantification of in situ PLA signals. The data represent the mean ± S.E. of 30–40 neurons from three independent experiments. ***, p < 0.00001; two-tailed unpaired t test. Ctrl, control. C, inhibition of lysosomal activity did not affect Lys-48-linked ubiquitination of GABAB receptors. Cortical neurons were treated as in B and analyzed for Lys-48-linked ubiquitination by in situ PLA using antibodies directed against GABAB1 and Lys-48-linked ubiquitin (white dots in representative images, scale bar, 5 μm). Right, quantification of in situ PLA signals. The data represent the mean ± S.E. of 27–37 neurons from three independent experiments; n.s., p > 0.05; two-tailed unpaired t test.
FIGURE 3.
FIGURE 3.
Identification of Lys-63-linked ubiquitination sites in GABAB1. A, GABAB1 is the main target for Lys-63-linked ubiquitination. HEK293 cells were either transfected with a GABAB1 mutant containing an inactivated ER retention signal (GABAB1a(RSAR)), which permits ER exit and cell surface targeting of the subunit when expressed alone, or with GABAB1 and GABAB2 and tested for Lys-63-linked ubiquitination by in situ PLA using GABAB1 antibodies in combination with an antibody detecting Lys-63-linked ubiquitin (white dots in representative images, scale bar, 7 μm). The data represent the mean ± S.E. of 47–49 neurons from three independent experiments. ns, p > 0.05; two-tailed unpaired t test. B, decreased Lys-63-linked ubiquitination of GABAB1(Lys → Arg) mutants. Cortical neurons were transfected with HA-tagged wild-type GABAB1a, HA-tagged GABAB1a(K697R/K698R), HA-tagged GABAB1a(K892R), or HA-tagged GABAB1a(K960R) together with wild-type GABAB2 and analyzed for Lys-63-linked ubiquitination by in situ PLA using antibodies directed against the HA tag and Lys-63-linked ubiquitin (white dots in representative images, scale bar, 7 μm). B′, quantification of in situ PLA signals. B″, schematic depicting the location of Lys → Arg mutations in GABAB1. The data represent the mean ± S.E. of 26–35 neurons from three independent experiments. ns, p > 0.05; ***, p < 0.0001; one-way ANOVA, Bonferroni's Multiple Comparison test.
FIGURE 4.
FIGURE 4.
GABAB1(Lys → Arg) mutants exhibit increased total and cell surface expression. A, increased total expression levels of GABAB1a(Lys → Arg) mutants. Neurons were transfected with HA-tagged wild-type GABAB1a, HA-tagged GABAB1a(K697R/K698R), HA-tagged GABAB1a(K892R), or HA-tagged GABAB1a(K960R) together with wild-type GABAB2 and analyzed for the expression level of transfected GABAB1 using antibodies directed against the HA tag. Left, representative images (scale bar, 7 μm). Right, quantification of fluorescence signals. The fluorescence signals of neurons transfected with wild-type GABAB1 were set to 100%. The data represent the mean ± S.E. of 23–27 neurons per experimental condition derived from three independent experiments. ***, p < 0.0001; one-way ANOVA, Dunnett's Multiple Comparison test. B, increased cell surface expression levels of GABAB1a(Lys → Arg) mutants. Neurons were transfected with HA-tagged wild-type GABAB1a, HA-tagged GABAB1a(K697R/K698R), HA-tagged GABAB1a(K892R), or HA-tagged GABAB1a(K960R) together with wild-type GABAB2 and analyzed for cell surface expression levels of transfected GABAB1 as well as transfected plus endogenous GABAB2 using antibodies directed against the HA tag and GABAB2, respectively. Left, representative images (scale bar, 7 μm). Right, quantification of fluorescence signals. The fluorescence signals of neurons transfected with wild-type GABAB1a or wild-type GABAB2, respectively, was set to 100%. The data represent the mean ± S.E. of 26–28 neurons per experimental condition derived from three independent experiments. **, p < 0.001; ***, p < 0.0001; one-way ANOVA, Dunnett's Multiple Comparison test.
FIGURE 5.
FIGURE 5.
Expression levels of GABAB1a(Lys → Arg) mutants are unaffected by inhibition of lysosomal degradation. A, total expression levels of GABAB1a(Lys → Arg) mutants are unaffected by blocking lysosomal activity with leupeptin. Neurons were transfected with HA-tagged wild-type GABAB1a or HA-tagged GABAB1a(Lys → Arg) mutants together with GABAB2, incubated with 100 μm leupeptin for 12 h, followed by immunostaining for transfected HA-tagged GABAB1 using HA antibodies. Left, representative images of untreated neurons (control, left) and of neurons incubated with leupeptin (right, scale bar, 7 μm). Right, quantification of fluorescence intensities. The fluorescence intensity of GABAB1a from untreated neurons (control) was set to 100%. The data represent the mean ± S.E. of 27–34 neurons per experimental condition derived from three independent experiments. ***, p < 0.0001, two-tailed unpaired t test. B, total expression levels of GABAB1a(Lys → Arg) mutants are unaffected upon blocking lysosomal targeting by inactivation of Rab7. Neurons were transfected with HA-tagged wild-type GABAB1a or GABAB1a(Lys → Arg) mutants together with GABAB2 and with either wild-type Rab7 or with a non-functional mutant of Rab7 (Rab7(DN)) and analyzed for total expression levels of transfected GABAB1 using HA antibodies. Left, representative images depicting total expression of transfected GABAB1a (scale bar, 7 μm). Right, quantification of fluorescence intensities. The fluorescence intensities of GABAB1a coexpressed with wild-type Rab7 were set to 100%. The data represent the mean ± S.E. of 27–34 neurons derived from three independent experiments. ***, p < 0.0001, two-tailed unpaired t test.
FIGURE 6.
FIGURE 6.
E3 ligase MIB2 colocalizes with GABAB receptors and affects their expression level. A and B, overexpression of MIB2 in neurons reduced expression levels of GABAB receptors. Neurons were either transfected with EGFP (controls) or MIB2 and analyzed for cell surface (A) or total (B) expression of GABAB receptors. Left, representative images (scale bar, 5 μm). Right, quantification of fluorescence intensities. The data represent the mean ± S.E. of 30 (A) and 45 (B) neurons derived from two independent experiments. ***, p < 0.0001, two-tailed unpaired t test. C, MIB2 and GABAB receptors extensively colocalize in cortical neurons. Neurons were simultaneously stained for GABAB1 (red) and MIB2 (green). Scale bar, 5 μm. D, GABAB receptors interact with MIB2. Neurons were stained for GABAB1 and MIB2 and analyzed for interaction via in situ PLA. Scale bar, 5 μm.
FIGURE 7.
FIGURE 7.
MIB2-induced down-regulation of GABAB receptors is mediated by Lys-63-linked ubiquitination. A, MIB2 mediates Lys-63-linked ubiquitination of GABAB receptors. Neurons were transfected with EGFP (control) or MIB2 and tested for Lys-63-linked ubiquitination of GABAB receptors using in situ PLA using antibodies directed against GABAB1 and Lys-63-linked ubiquitin (white dots in representative images, scale bar, 5 μm). The graph depicts quantification of the in situ PLA signals. The data represent the mean ± S.E. of 20 neurons per condition derived from two independent experiments. *, p < 0.05, two-tailed unpaired t test. B, MIB2-induced down-regulation of GABAB receptors is mediated by Lys-63-linked ubiquitination. Neurons were transfected with either wild-type ubiquitin (WT Ub), mutant ubiquitin that cannot form Lys-63 linkages (Ub(K63R), mutant ubiquitin that can only form Lys-63 linkages (Ub(Lys-63), and mutant ubiquitin that is deficient in forming Lys-48 linkages (Ub(K48R)), and with or without (control) MIB2 followed by determination of cell surface GABAB receptors using GABAB1 antibodies. Left, representative images (scale bar, 5 μm). Right, quantification of fluorescence intensities. The data represent the mean ± S.E. of 20–22 neurons for each condition derived from two independent experiments. ns, p > 0.05; **, p < 0.005; ***, p < 0.0005, two-tailed unpaired t test; ns, p > 0.05.
FIGURE 8.
FIGURE 8.
MIB2 mediates Lys-63-linked ubiquitination of GABAB receptors. GABAB1a(Lys → Arg) mutants, which are partially resistant to Lys-63-linked ubiquitination, are not affected by overexpression of MIB2. Neurons were transfected with HA-tagged wild-type GABAB1a (WT GABAB1), GABAB1a(K697/698R), GABAB1a(K892R) or GABAB1a(K960R) with (+MIB2) or without (control) MIB2 and analyzed for cell surface expression of wild-type and mutant GABAB1a using HA antibodies. Left, representative images, scale bar, 5 μm. Right, quantification of fluorescence intensities. The data represent the mean ± S.E. of 19–24 neurons per experimental condition derived from two independent experiments. ns, p > 0.05; **, p < 0.005, two-tailed unpaired t test.
FIGURE 9.
FIGURE 9.
GABAB1a(Lys → Arg) mutants are resistant to glutamate-induced down-regulation. Neurons transfected with HA-tagged wild-type GABAB1a or HA-tagged GABAB1a(Lys → Arg) mutants along with GABAB2 were incubated in the presence (glutamate) or absence (control) of 50 μm glutamate for 90 min followed by cell surface staining for transfected GABAB1a using HA antibodies. Left, representative images, scale bar, 5 μm. Right, quantification of fluorescence intensities. The fluorescence intensity of neurons not treated with glutamate was set to 100%. The data represent the mean ± S.E. of 20–25 neurons per experimental condition derived from two independent experiments. ***, p < 0.0005, two-tailed unpaired t test.
FIGURE 10.
FIGURE 10.
Glutamate-induced down-regulation of GABAB receptors is mediated by Lys-63-linked ubiquitination. A, sustained activation of glutamate receptors enhanced Lys-63-linked ubiquitination of GABAB receptors. Neurons were incubated for 60 min in the absence (control) or presence of 50 μm glutamate and analyzed for Lys-63-linked ubiquitination by in situ PLA using antibodies directed against GABAB1 and Lys-63-linked ubiquitin (white dots in representative images, scale bar, 5 μm). The graph depicts quantification of the in situ PLA signals. The data represent the mean ± S.E. of 20 neurons derived from two independent experiments. **, p < 0.01; one-way ANOVA, Dunnett's Multiple Comparison test. B, preventing Lys-63-linked ubiquitination rendered GABAB receptors resistant to glutamate-induced down-regulation. Neurons were transfected with wild-type ubiquitin (Ub(WT)), and mutants of ubiquitin that either permits only Lys-63-linked ubiquitination (Ub(Lys-63)) or prevents any kind of ubiquitin chain generation (Ub(KO)). Neurons were incubated for 90 min in the absence (control) or presence of 50 μm glutamate followed by determination of cell surface GABAB receptors using GABAB1 antibodies. Left, representative images, scale bar, 5 μm. Right, quantification of fluorescence intensities. The data represent the mean ± S.E. of 30–36 neurons from three independent experiments. ***, p < 0.0001; two-tailed unpaired t test; ns, p > 0.05.
FIGURE 11.
FIGURE 11.
Glutamate exposure increases the expression level of MIB2 and the MIB2-GABAB receptor interaction. A, increased MIB2 expression after glutamate exposure. Neurons were treated either for 15 or 30 min with glutamate and analyzed for MIB2 expression. Left, representative images, scale bar, 10 μm. Right, quantification of fluorescence intensities. The data represent the mean ± S.E. of 30 neurons from two independent experiments. ***, p < 0.0001; one-way ANOVA, Dunnett's Multiple Comparison test. B, increased interaction of GABAB receptors with MIB2 after glutamate exposure. Neurons were treated either for 15 or 30 min with glutamate and analyzed for the interaction of MIB2 with GABAB receptors using in situ PLA. Left, representative images, scale bar, 5 μm. Right, quantification of the in situ PLA signals. The data represent the mean ± S.E. of 14 neurons from two independent experiments. ***, p < 0.0003; one-way ANOVA, Dunnett's Multiple Comparison test.

Similar articles

Cited by

References

    1. Komander D., and Rape M. (2012) The ubiquitin code. Annu. Rev. Biochem. 81, 203–229 - PubMed
    1. Benke D., Zemoura K., and Maier P. J. (2012) Modulation of cell surface GABAB receptors by desensitization, trafficking and regulated degradation. World J. Biol. Chem. 3, 61–72 - PMC - PubMed
    1. Pinard A., Seddik R., and Bettler B. (2010) GABAB receptors: physiological functions and mechanisms of diversity. Adv. Pharmacol. 58, 231–255 - PubMed
    1. Craig M. T., and McBain C. J. (2014) The emerging role of GABAB receptors as regulators of network dynamics: fast actions from a 'slow' receptor? Curr. Opin. Neurobiol. 26, 15–21 - PMC - PubMed
    1. Kohl M. M., and Paulsen O. (2010) The roles of GABAB receptors in cortical network activity. Adv. Pharmacol. 58, 205–229 - PubMed

Substances

LinkOut - more resources