

Effect of Body Weight on Echocardiographic Measurements in 19,866 Pure-Bred Cats with or without Heart Disease
- PMID: 27573384
- PMCID: PMC5032876
- DOI: 10.1111/jvim.14569
Effect of Body Weight on Echocardiographic Measurements in 19,866 Pure-Bred Cats with or without Heart Disease
Abstract
Background: Echocardiography is a cost-efficient method to screen cats for presence of heart disease. Current reference intervals for feline cardiac dimensions do not account for body weight (BW).
Objective: To study the effect of BW on heart rate (HR), aortic (Ao), left atrial (LA) and ventricular (LV) linear dimensions in cats, and to calculate 95% prediction intervals for these variables in normal adult pure-bred cats.
Animals: 19 866 pure-bred cats.
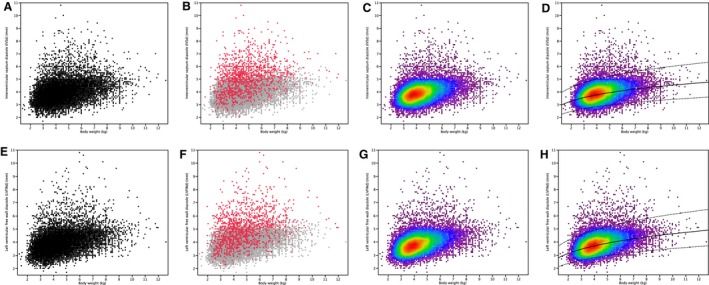
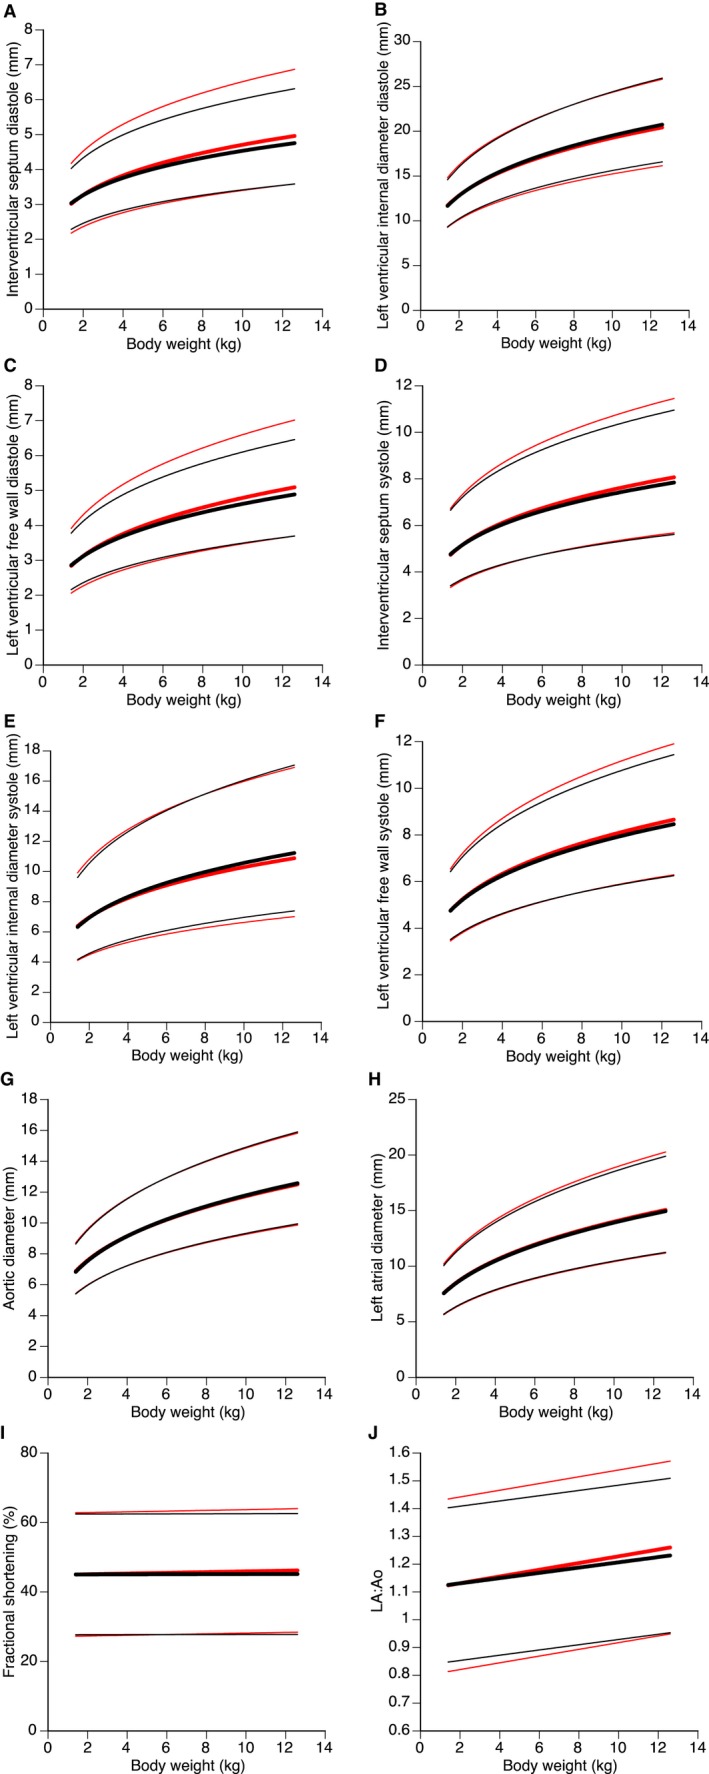
Methods: Clinical data from heart screens conducted between 1999 and 2014 were included. Associations between BW, HR, and cardiac dimensions were assessed using univariate linear models and allometric scaling, including all cats, and only those considered normal, respectively. Prediction intervals were created using 95% confidence intervals obtained from regression curves.
Results: Associations between BW and echocardiographic dimensions were best described by allometric scaling, and all dimensions increased with increasing BW (all P<0.001). Strongest associations were found between BW and Ao, LV end diastolic, LA dimensions, and thickness of LV free wall. Weak linear associations were found between BW and HR and left atrial to aortic ratio (LA:Ao), for which HR decreased with increasing BW (P<0.001), and LA:Ao increased with increasing BW (P<0.001). Marginal differences were found for prediction formulas and prediction intervals when the dataset included all cats versus only those considered normal.
Conclusions and importance: BW had a clinically relevant effect on echocardiographic dimensions in cats, and BW based 95% prediction intervals may help in screening cats for heart disease.
Keywords: Heart dimensions; M-mode; Prediction intervals; Screening.
Copyright © 2016 The Authors. Journal of Veterinary Internal Medicine published by Wiley Periodicals, Inc. on behalf of the American College of Veterinary Internal Medicine.
Figures
References
-
- Jacobs G, Knight DH. M‐mode echocardiographic measurements in nonanesthetized healthy cats: Effects of body weight, heart rate, and other variables. Am J Vet Res 1985;46:1705–1711. - PubMed
-
- Moise NS, Dietze AE, Mezza LE, et al. Echocardiography, electrocardiography, and radiography of cats with dilatation cardiomyopathy, hypertrophic cardiomyopathy, and hyperthyroidism. Am J Vet Res 1986;47:1476–1486. - PubMed
-
- Pipers FS, Reef V, Hamlin RL. Echocardiography in the domestic cat. Am J Vet Res 1979;40:882–886. - PubMed
-
- Sisson DD, Knight DH, Helinski C, et al. Plasma taurine concentrations and M‐mode echocardiographic measures in healthy cats and in cats with dilated cardiomyopathy. J Vet Intern Med 1991;5:232–238. - PubMed
-
- Chetboul V, Petit A, Gouni V, et al. Prospective echocardiographic and tissue Doppler screening of a large Sphynx cat population: Reference ranges, heart disease prevalence and genetic aspects. J Vet Cardiol 2012;14:497–509. - PubMed
MeSH terms
LinkOut - more resources
Full Text Sources
Other Literature Sources
Miscellaneous
